Japan is a USD 5 Trillion economy. The country is home to 126 million residents, with a high consumption potential. The GDP of the country has shown a significant growth from USD 4.4 Trillion in 2015 to USD 5.1 Trillion in 2019. On an average, the final consumption of the country accounts for around 74% of the GDP whereas the household consumption accounts for around 54% of the GDP, indicating a potential consumer goods market.
Japan is a USD 701 Bn import market, which is largely serviced by exporters from US, Australia and Asian countries. and. Japan’s imports have grown from USD 608 Billion in 2016 to USD 769 Billion in 2021. It had seen a drop to USD 635 Billion in 2020 due to the outbreak of the COVID, that led to disrupted global supply chains, but it bounced back with around 21%, showing high potential in the market.
China contributes the highest to Canadian imports with a 24% of the share, followed by US that holds 11%. The top 10 countries contributing approximately 70% of imports to other than China and US are Australia, South Korea, Saudi Arabia, Thailand, Germany, UAE, Vietnam, Indonesia. India is the 13th largest exporter to Japan among the Asian countries. On an average, India contributes to 1% of Japan’s imports. A detailed list of key countries exporting to Japan is attached in annexure 01.
There is a CEPA (Comprehensive Economic Partnership Agreement) signed between India and Japan in order to liberate and facilitate trading of goods and services among the countries, improve the trading environment and enhance overall economic co-operation between the two nations.

Japan in general imports USD 701 Billion worth of products on an average basis. Of that the leading sectors that contribute to ~63% of Japan’s imports are mineral fuels, Machinery & equipment, Vehicles & auto-components, Electricals & electronics, pharmaceuticals, gems and jewelry, organic chemicals, Plastics & its articles, ores and ashes, and Optical, photographic & Cinematographic devices. A detailed list of sectors is attached in Annexure 2.

| Table 1: Top service contributing to imports of Japan | ||||||
|---|---|---|---|---|---|---|
| Code | Service Label | Imported value in 2017 | Imported value in 2018 | Imported value in 2019 | 3 year average | % share |
| 'TOTAL | All Service | 381,211 | 402,027 | 407,977 | 397,072 | 100% |
| SOX1 | Memo item: Other commercial services | 122,345 | 131,850 | 138,308 | 130,834 | 33% |
| 10.3 | Technical, trade-related, and other business services | 32,617 | 34,797 | 36,995 | 34,803 | 9% |
| SDZ | Tourism-related services in travel and passenger transport (alternative breakdown) | 25,773 | 28,116 | 29,130 | 27,673 | 7% |
| 8 | Charges for the use of intellectual property n.i.e. | 21,380 | 22,009 | 26,268 | 23,219 | 6% |
| 3a.2 | Freight transport, All modes (alternative breakdown) | 20,719 | 23,509 | 22,293 | 22,173 | 6% |
| 3.1.2 | Freight transport, Sea | 19,089 | 21,723 | 20,593 | 20,468 | 5% |
| 10.1 | Research and development (R&D) | 17,373 | 20,196 | 18,933 | 18,834 | 5% |
| 9.2 | Computer services | 11,739 | 14,684 | 18,320 | 14,914 | 4% |
| 4.2.3 | Travel, Personal, Other (other than health and education) | 13,442 | 14,684 | 15,805 | 14,643 | 4% |
| 10.2 | Professional and management consulting services | 13,178 | 13,470 | 10,759 | 12,469 | 3% |
| 7 | Financial services | 7,692 | 8,227 | 8,485 | 8,135 | 2% |
| 5 | Construction | 8,224 | 8,241 | 7,333 | 7,932 | 2% |
| 3a.1 | Passenger transport, All modes (alternative breakdown) | 7,584 | 7,899 | 7,866 | 7,783 | 2% |
| 3a.3 | Other transport (other than passenger and freight), All modes (alternative breakdown) | 11,754 | 7,274 | 4,105 | 7,711 | 2% |
| 3.2.1 | Passenger transport, Air | 7,489 | 7,766 | 7,731 | 7,662 | 2% |
| 6 | Insurance and pension services | 6,332 | 6,954 | 8,109 | 7,132 | 2% |
| 3.1.3 | Other transport, Sea (other than passenger and freight) | 10,944 | 6,313 | 3,125 | 6,794 | 2% |
| 2 | Maintenance and repair services n.i.e. | 4,934 | 5,496 | 6,344 | 5,592 | 1% |
| 1 | Manufacturing services on physical inputs owned by others | 5,493 | 5,132 | 4,205 | 4,943 | 1% |
| 4.1 | Travel, Business | 2,725 | 3,422 | 3,266 | 3,138 | 1% |
| 4.2.2 | Travel, Personal, Education-related | 2,022 | 2,111 | 2,194 | 2,109 | 1% |
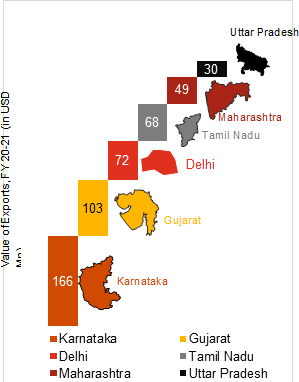
India exports an average of USD 4.47 Billion worth of goods to Japan per year. India’s share in the country’s imports have remain constant mostly, with being 0.8% in 2016 and 2017, and then 0.7% in 2018, 2019, 2020. India exported commodities worth USD 4.4 Billion last year. Karnataka, Gujarat, Delhi, Tamil Nadu, Maharashtra, and Uttar Pradesh are the top 6 states exporting the highest value of Machinery and Electronics to Japan
India’s exports to Japan are characterized by exports of the following top 10 sectors: Mineral fuels & oils, gems & Jewellery, pharmaceuticals, machinery, apparels & textiles, electricals & electronics, footwear, vehicles & auto-components, organic chemicals, aircrafts etc. as shown in table below. The table also discusses the percentage share of the sector in India’s exports to Japan and the contribution of India’s exports in Japan’s total imports of that sector at a HS 2 level. The sectors highlighted in yellow are the key sectors identified for driving exports growth from Uttar Pradesh.
| Table 2: Top sectors contributing to 67% of India’s exports to Japan | |||
|---|---|---|---|
| Sector | India’s exports to Japan, (USD Mn) | % share of sector in India’s exports globally | % share of India’s exports to Japan’s imports |
| HS 27, Mineral fuels & products | 589.9 | 13.2% | 13.2% |
| HS 29, Organic Chemicals | 548.6 | 5.7% | 12.3% |
| HS 03, Fish and invertibrates | 369.1 | 1.8% | 8.3% |
| HS 84, Machinery & Equipment | 347.5 | 6.4% | 7.8% |
| HS 71, Gems and Jewelry | 338.7 | 10.2% | 7.6% |
| HS 87, Vehicles & Auto-components | 218 | 4.9% | 4.9% |
| HS 72 & 73 Iron and Steel Articles | 247.4 | 6.7% | 5.5% |
| HS 85 Electricals & Electronics | 169.3 | 4.7% | 3.8% |
| HS 76 Aluminium & articles | 162.6 | 2% | 3.6% |
| HS 38, Miscellaneous chemical products | 153.1 | 1.6% | 3.4% |
| Total exports (3 year average) | USD 4.5 Bn | ||
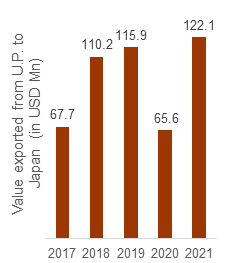
The exports from Uttar Pradesh to Japan grew at a CAGR of 2.7% in the last 5 years. Uttar Pradesh exported a total of USD 122 Million value of commodities to Japan in 2021. After the post the COVID impact in 2020, the exports from UP to Japan accelerated by approximately 86% in 2021, indicating a high potential for growth in the future.
12 select sectors contributed to approximately 82% of UP’s exports to Japan during the last 3 years. The 5 particular sectors have high growth rate of exports from UP to Japan in Japan when compared to the growth rate of exports from UP to the rest of the world. These are the sectors that have the highest export percentage that other products that are being imported by Japan from UP. The table below summarizes the top 12 products exported from UP to Japan:
| Top commodities exported from UP to Japan | |||||
|---|---|---|---|---|---|
| HS code | Product description | Value of Exports (in USD Mn) | % share in UP’s exports to Japan | Growth rate of exports from UP to Japan | Growth rate of exports from UP to all markets |
| 84 | Machinery & Equipment | 611 | 15.7% | 3.3% | 9% |
| 85 | Electricals & Electronics | 2,773.9 | 13.9% | 24.2% | 9.4% |
| 29 | Organic Chemicals | 483.7 | 11.3% | 11.8% | -1.8% |
| 87 | Vehicles & Auto-components | 492.7 | 9.0% | 27.6% | 19.9% |
| 61 & 62 | Apparels | 1,489.1 | 9.5& | -49% | -4.8% |
| 33 | Essential oils and resinoids | 220.8 | 6.7% | -28.5% | -0.3% |
| 64 & 42 | Leather goods and Footwears | 1,597 | 7.8% | -33.4% | 2% |
| 57 | Carpets and other textile floor coverings | 546.5 | 5.2% | -11.2% | 9.5% |
| 72 & 73 | Iron and Steel acrticles | 736.3 | 4% | -43.7% | 50.6% |
| 63 | Other made-up textile articles | 221.5 | 3% | -15.5% | 11.1% |
| 38 | Miscellaneous chemical products | 78.5 | 1.7% | 11.3% | 8.2% |
| 39 | Plastic & article thereof | 223.4 | 1.7% | 67.6% | 3.7% |
Select sectors are identified as potential opportunities which may drive growth of exports from Uttar Pradesh to Japan. The sectors are selected based on the import demand in Japan, India’s exports to Japan and UP’s exports to Japan.
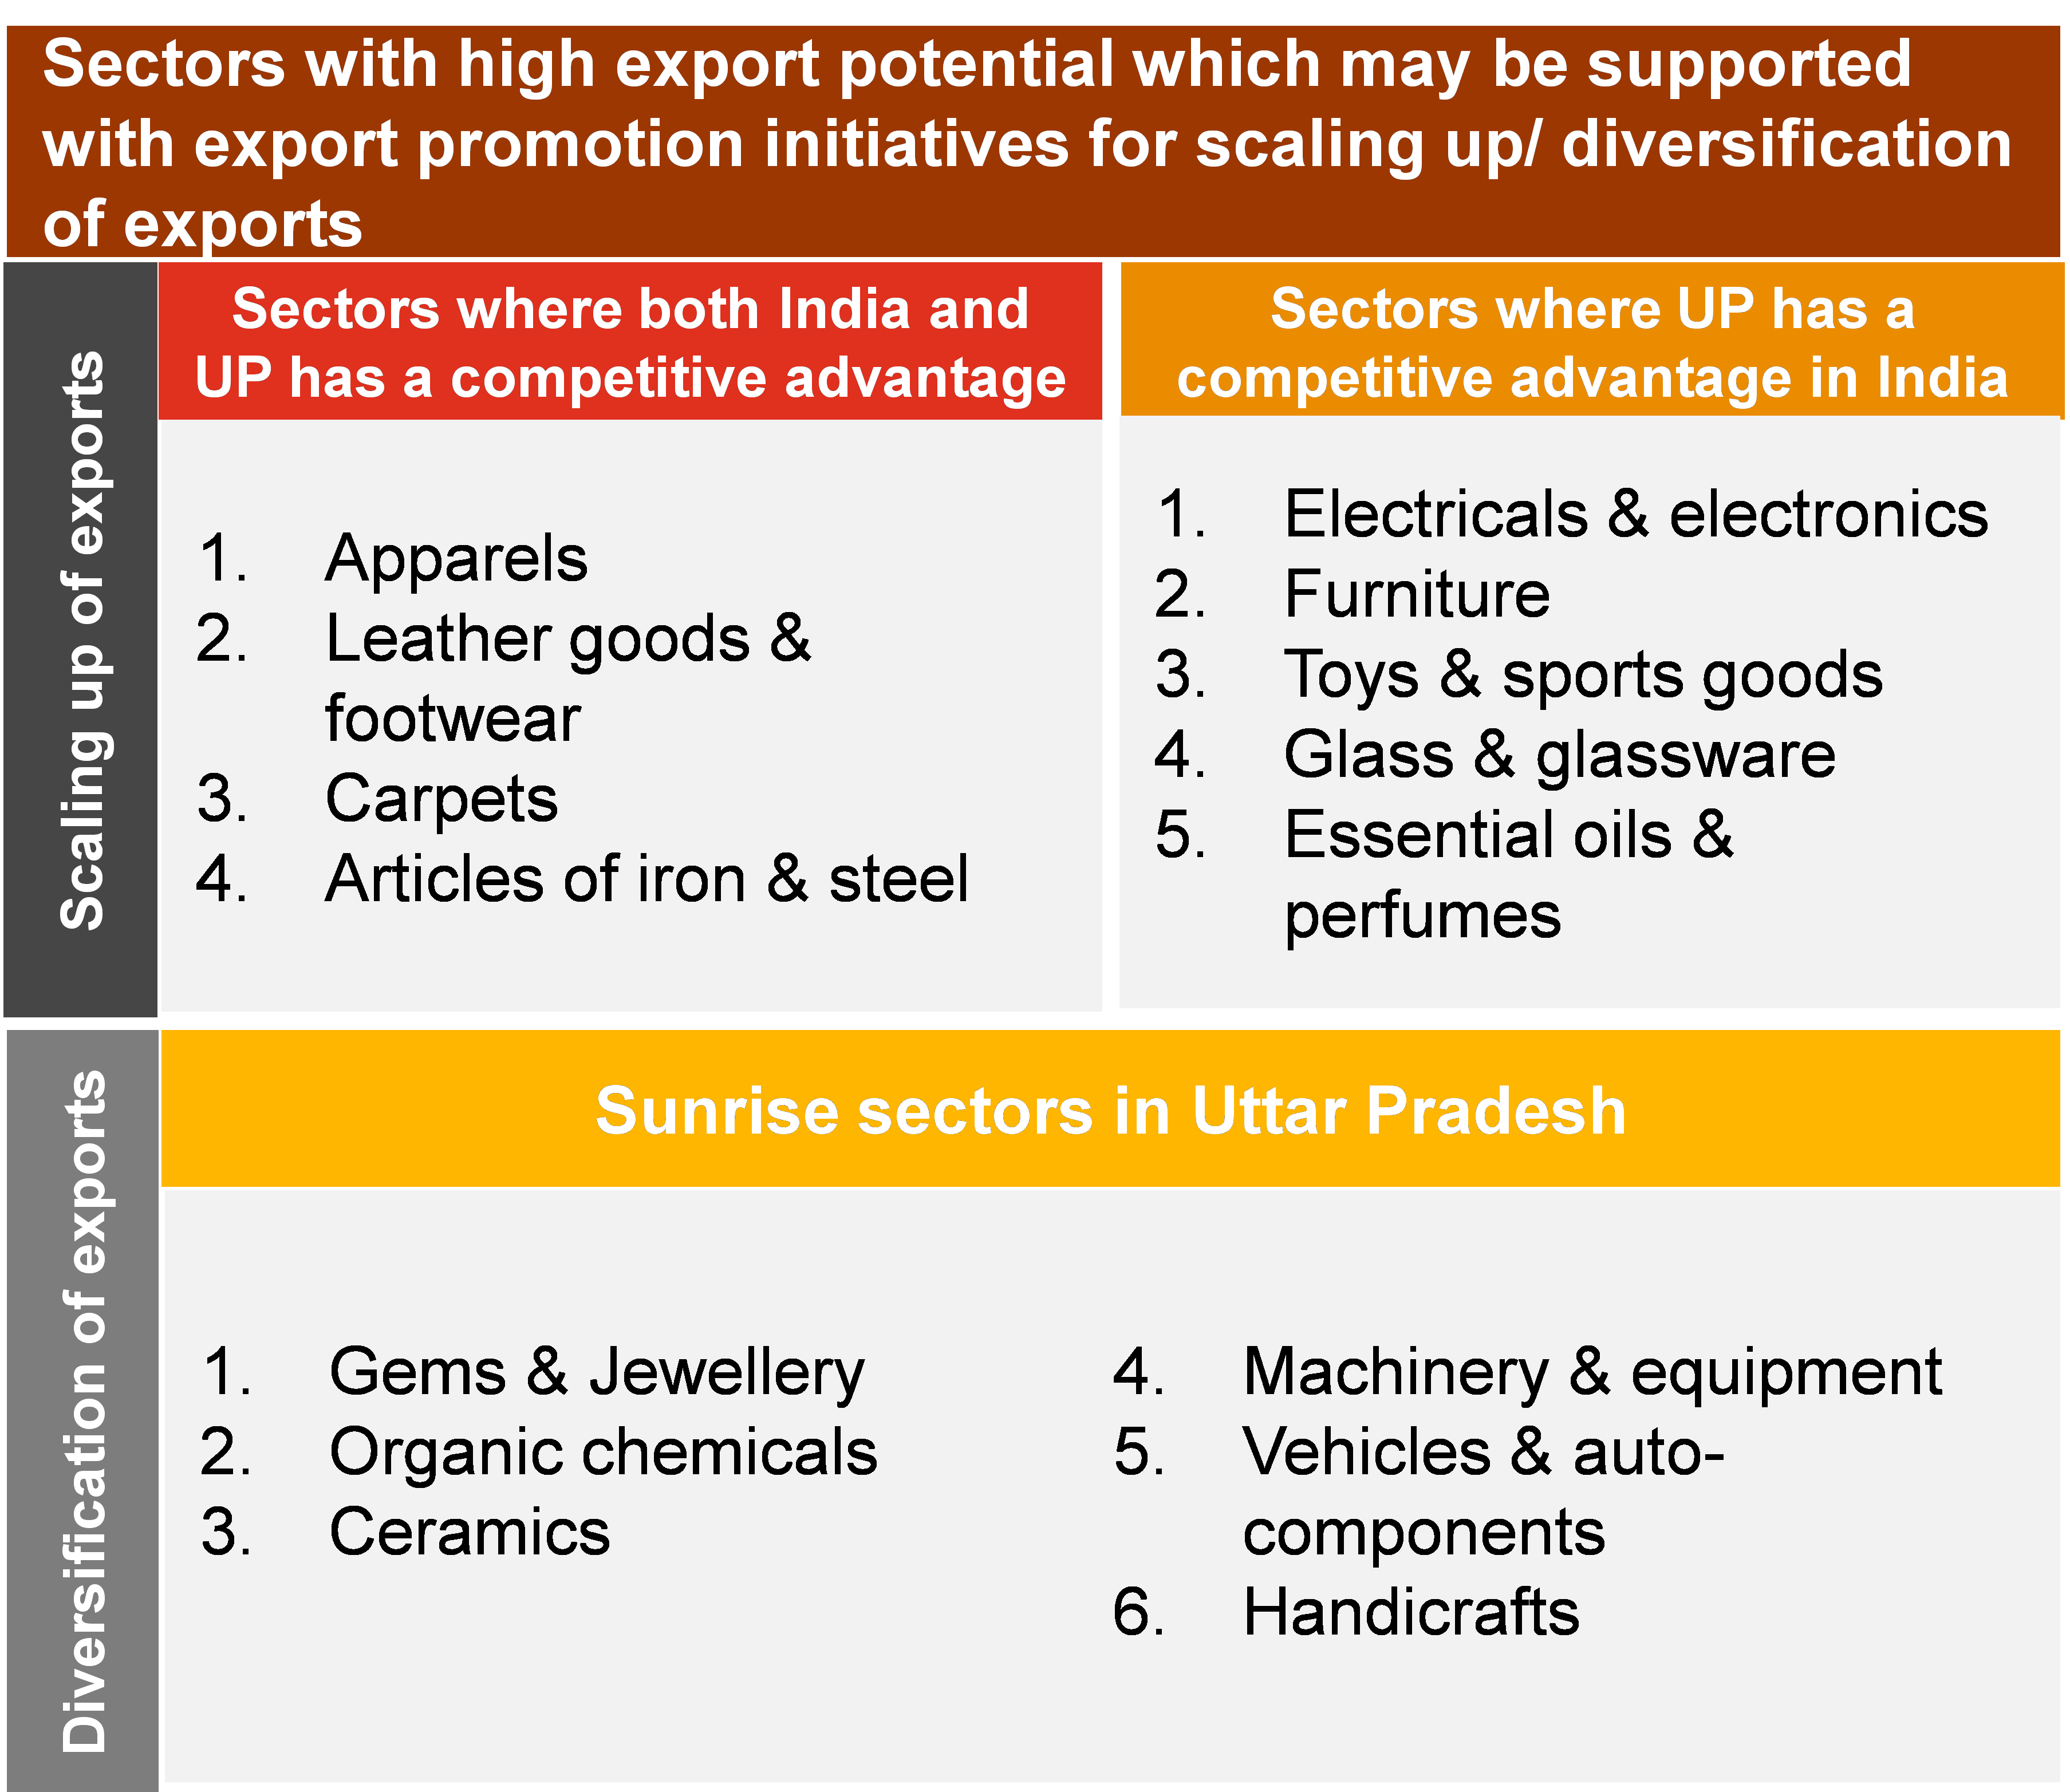
The priority sectors shortlisted are classified into two categories, based on the relevant strategy for export promotion. The sectors with significant manufacturing and exports volume to Japan are strategically selected for scaling up of exports. The sectors with appreciable manufacturing volume, but low level of exports from UP to Japan are selected for market diversification into Japan. The table below summarizes the top 10 sectors shortlisted for UP’s exporters who intend to undertake exports in Japan. Electricals & electronics, Engineering goods, autocomponents, organic chemicals and apparels sectors are shortlisted for scaling up. Similarly, Pharmaceuticals, Plastics & its articles, Gems & Jewellery, Articles of iron & steel, and Furniture sectors are selected for diversification. A comprehensive detail for the select 10 sectors at a HS 6 level is described in annexure 3. With the India Japan CEPA in place, there are potential opportunities to grow bilateral trade and investment. The CEPA enables Uttar Pradesh to leverage its export capabilities in select sectors which resonates with the consumer demands in Japan. At a global level, the priority sectors are classified on based on their RCA scores to identify the relevant export promotion strategies. The traditional sectors for which UP has a competitive advantage are selected for scaling up globally. Similarly, the sunrise sectors are selected for product development and market diversification to boost exports as shown in Figure 5. Further, to support exporters of the state in scaling of exports, the government of Uttar Pradesh through Export Promotion Bureau – Uttar Pradesh and Uttar Pradesh Export Promotion Council has planned to undertake the following initiatives: 1. Identifying and connecting with Sectoral bodies (for priority sectors) based in Japan 2. Identifying importers and their sourcing needs 3. List of key events where UP's exporters shall participate 4. Facilitate visit of Japan’s Importers to UP in key trade events that may be organized by Government of Uttar Pradesh 5. Identification of online platforms where UP's exporters should register for exporting their products to meet sourcing requirements of UK’s importers
| Potential sectors for driving UP’s exports growth in Japan | |||||
|---|---|---|---|---|---|
| HS Code | Product Description | Value imported by Japan (USD Mn) | Exports from India to Japan (USD Mn) | UP’s exports to Japan (USD Mn) | Potential intervention strategy |
| 85 | Electricals & Electronics | 98,891 | 169.3 | 14.1 | Scale up |
| 84 | Machinery & Equipment | 70,178 | 347.5 | 15.9 | Scale up |
| 30 | Pharmaceuticals | 27,126 | 66.9 | 0.05 | Diversification |
| 87 | Vehicles & Auto-components | 22,717 | 218 | 9.1 | Scale up |
| 29 | Organic Chemicals | 16,722 | 548.6 | 11.4 | Scale up |
| 39 | Plastics & articles thereof | 16,023 | 74.9 | 1.7 | Diversification |
| 71 | Gems & Jewelry | 13,739 | 338.7 | 1.2 | Diversification |
| 61 & 62 | Apparels | 26,802 | 182.4 | 9.6 | Scale up |
| 72 & 73 | Iron and Steel Articles | 14,553 | 247.4 | 4 | Diversification |
| 94 | Furnitures | 8,191 | 7.7 | 0.3 | Diversification |
| Exporters | Imported value in 2018 | Imported value in 2019 | Imported value in 2020 | 3 year average | % share |
|---|---|---|---|---|---|
| Total | 749,092 | 720,964 | 634,678 | 701,578 | 100% |
| China | 173,815 | 169,236 | 163,761 | 168,937 | 24% |
| United States of America | 83,668 | 81,259 | 71,703 | 78,877 | 11% |
| Australia | 45,734 | 45,462 | 35,654 | 42,283 | 6% |
| Korea, Republic of | 32,149 | 29,629 | 26,591 | 29,457 | 4% |
| Taipei, Chinese | 27,135 | 26,860 | 26,763 | 26,919 | 4% |
| Saudi Arabia | 33,815 | 27,666 | 18,453 | 26,644 | 4% |
| Thailand | 25,087 | 25,363 | 23,765 | 24,738 | 4% |
| Germany | 25,989 | 24,936 | 21,221 | 24,049 | 3% |
| United Arab Emirates | 27,610 | 26,197 | 16,392 | 23,400 | 3% |
| Viet Nam | 21,145 | 22,477 | 22,042 | 21,888 | 3% |
| Indonesia | 21,604 | 18,148 | 15,407 | 18,386 | 3% |
| Malaysia | 18,937 | 17,653 | 15,931 | 17,507 | 2% |
| Russian Federation | 15,605 | 14,345 | 10,738 | 13,563 | 2% |
| Qatar | 14,874 | 13,157 | 9,187 | 12,406 | 2% |
| Canada | 11,745 | 11,828 | 10,759 | 11,444 | 2% |
| Italy | 11,416 | 11,601 | 10,496 | 11,171 | 2% |
| France | 11,051 | 12,047 | 9,247 | 10,782 | 2% |
| Philippines | 10,435 | 10,570 | 9,309 | 10,105 | 1% |
| Singapore | 9,745 | 7,804 | 8,550 | 8,700 | 1% |
| Switzerland | 7,758 | 8,184 | 7,452 | 7,798 | 1% |
| Others | 119,777 | 116,541 | 101,257 | 112,525 | 16% |
| HS Code | Product Description | Imported value in 2018 | Imported value in 2019 | Imported value in 2020 | 3 year average | % share |
|---|---|---|---|---|---|---|
| TOTAL | All products | 749,092 | 720,964 | 634,678 | 701,578 | 100% |
| 27 | Mineral fuels, mineral oils and products of their distillation; bituminous substances; mineral waxes | 174,777 | 155,709 | 105,564 | 145,350 | 20% |
| 85 | Electrical machinery and equipment and parts thereof; sound recorders and reproducers, television image and sound recorders and reproducers, and parts and accessories of such articles | 101,197 | 98,779 | 96,698 | 98,891 | 14% |
| '84 | Machinery, mechanical appliances, nuclear reactors, boilers; parts thereof | 72,924 | 70,541 | 67,068 | 70,178 | 10% |
| '90 | Optical, photographic, cinematographic, measuring, checking, precision, medical or surgical instruments and apparatus; parts and accessories thereof | 27,640 | 28,231 | 25,899 | 27,257 | 4% |
| '30 | Pharmaceutical products | 25,527 | 27,228 | 28,624 | 27,126 | 4% |
| '87 | Vehicles other than railway or tramway rolling stock, and parts and accessories thereof | 24,600 | 23,762 | 19,789 | 22,717 | 3% |
| '26 | Ores, slag and ash | 22,442 | 22,216 | 21,196 | 21,951 | 3% |
| '29 | Organic chemicals | 18,228 | 16,107 | 15,832 | 16,722 | 2% |
| '39 | Plastics and articles thereof | 16,922 | 16,175 | 14,973 | 16,023 | 2% |
| '71 | Natural or cultured pearls, precious or semi-precious stones, precious metals, metals clad with precious metal, and articles thereof; imitation jewellery; coin | 12,540 | 12,773 | 15,905 | 13,739 | 2% |
| '62 | Articles of apparel and clothing accessories, not knitted or crocheted | 14,708 | 14,302 | 11,965 | 13,658 | 2% |
| '61 | Articles of apparel and clothing accessories, knitted or crocheted | 13,781 | 13,663 | 11,989 | 13,145 | 2% |
| '99 | Commodities not elsewhere specified | 11,737 | 11,874 | 10,885 | 11,498 | 2% |
| '03 | Fish and crustaceans, molluscs and other aquatic invertebrates | 11,884 | 11,541 | 9,940 | 11,122 | 2% |
| '02 | Meat and edible meat offal | 10,407 | 10,843 | 10,285 | 10,512 | 1% |
| '44 | Wood and articles of wood; wood charcoal | 11,169 | 10,682 | 8,841 | 10,231 | 1% |
| '94 | Furniture; bedding, mattresses, mattress supports, cushions and similar stuffed furnishings; lamps and lighting fittings, not elsewhere specified or included; illuminated signs, illuminated nameplates and the like; prefabricated buildings | 8,162 | 8,355 | 8,057 | 8,191 | 1% |
| '76 | Aluminium and articles thereof | 9,350 | 8,015 | 6,550 | 7,972 | 1% |
| '73 | Articles of iron or steel | 7,596 | 7,663 | 6,715 | 7,325 | 1% |
| '72 | Iron and steel | 8,269 | 7,726 | 5,692 | 7,229 | 1% |
| '28 | Inorganic chemicals; organic or inorganic compounds of precious metals, of rare-earth metals, of radioactive elements or of isotopes | 8,538 | 7,083 | 5,825 | 7,149 | 1% |
| '88 | Aircraft, spacecraft, and parts thereof | 6,718 | 8,383 | 4,198 | 6,433 | 1% |
| '16 | Preparations of meat, of fish or of crustaceans, molluscs or other aquatic invertebrates | 6,589 | 6,607 | 6,103 | 6,433 | 1% |
| '95 | Toys, games and sports requisites; parts and accessories thereof | 6,425 | 6,143 | 5,966 | 6,178 | 1% |
| '38 | Miscellaneous chemical products | 5,994 | 5,905 | 6,117 | 6,005 | 1% |
| '10 | Cereals | 6,043 | 5,978 | 5,773 | 5,932 | 1% |
| '42 | Articles of leather; saddlery and harness; travel goods, handbags and similar containers; articles of animal gut (other than silkworm gut) | 6,054 | 6,356 | 5,086 | 5,832 | 1% |
| '24 | Tobacco and manufactured tobacco substitutes | 5,339 | 5,493 | 5,444 | 5,425 | 1% |
| Others | 93,532 | 92,830 | 87,701 | 91,354 | 15% |
| HS Code (6 digit) | Product Description | Share in Japan’s import at the HS 2 level | Average share in global imports at HS2 level | Global exports by India | India’s share in global exports | Global exports by Uttar Pradesh |
|---|---|---|---|---|---|---|
| HS 85 – Electrical & Electronics | ||||||
| '851712 | Telephones for cellular networks "mobile telephones" or for other wireless networks | 16.2% | 9.5% | 2496.42 | 0.9% | 1416.3 |
| '854239 | Electronic integrated circuits (excluding such as processors, controllers, memories and amplifiers) | 8.5% | 9.2% | 143.80 | 0.1% | 3.8 |
| '854231 | Electronic integrated circuits as processors and controllers, whether or not combined with memories, converters, logic circuits, amplifiers, clock and timing circuits, or other circuits | 7.2% | 12.0% | 84.21 | 0.0% | 11.4 |
| '851762 | Machines for the reception, conversion and transmission or regeneration of voice, images or other data, incl. switching and routing apparatus (excluding telephone sets, telephones for cellular networks or for other wireless networks) | 6.3% | 5.8% | 568.49 | 0.4% | 17.4 |
| '854430 | Ignition wiring sets and other wiring sets for vehicles, aircraft or ships | 4.8% | 1.4% | 214.92 | 0.6% | 14.5 |
| '854140 | Photosensitive semiconductor devices, incl. photovoltaic cells whether or not assembled in modules or made up into panels; light emitting diodes (excluding photovoltaic generators) | 3.5% | 1.9% | 168.87 | 0.3% | 0.6 |
| '854232 | Electronic integrated circuits as memories | 3.2% | 7.2% | 11.09 | 0.0% | 61.3 |
| '852990 | Parts suitable for use solely or principally with transmission and reception apparatus for radio-broadcasting or television, television cameras,digital cameras, video camera recorders, radar apparatus, radio navigational aid apparatus or radio remote control apparatus, monitors and projectors, n.e.s. (excluding for aerials and aerial reflectors of all kinds) | 2.8% | 2.1% | 128.37 | 0.2% | 75 |
| '852580 | Television cameras, digital cameras and video camera recorders | 2.3% | 1.3% | 69.88 | 0.2% | 4.7 |
| '854370 | Electrical machines and apparatus, having individual functions, n.e.s. in chapter 85 | 2.2% | 1.2% | 77.21 | 0.2% | 27.3 |
| Total of 10 commodity | 57.2% | 3963.26 | 1632.3 | |||
| Rest of the commodities under HS code 85 | 42.8% | 13,424 | 2,774 | |||
| HS 84 - Machinery & Equipment | ||||||
| '847130 | Data-processing machines, automatic, portable, weighing <= 10 kg, consisting of at least a central processing unit, a keyboard and a display (excluding peripheral units) | 12.7% | 6.9% | 48.76 | 0.03% | 0.8 |
| '847150 | Processing units for automatic data-processing machines, whether or not containing in the same housing one or two of the following types of unit: storage units, input units, output units (excluding those of heading 8471.41 or 8471.49 and excluding peripheral units) | 6.0% | 3.6% | 45.01 | 0.06% | 0.4 |
| '841191 | Parts of turbojets or turbopropellers, n.e.s. | 5.1% | 3.2% | 109.68 | 0.22% | 0 |
| '848620 | Machines and apparatus for the manufacture of semiconductor devices or of electronic integrated circuits | 4.2% | 1.9% | 0.37 | 0.00% | 0.004 |
| '847330 | Parts and accessories of automatic data-processing machines or for other machines of heading 8471, n.e.s. | 3.8% | 5.7% | 103.04 | 0.08% | 7.8 |
| '847170 | Storage units for automatic data-processing machines | 3.3% | 3.5% | 28.66 | 0.04% | 0.09 |
| '841112 | Turbojets of a thrust > 25 kN | 3.0% | 2.6% | 2967.2 | 6.15% | 1.7 |
| '844399 | Parts and accessories of printers, copying machines and facsimile machines, n.e.s. (excluding of printing machinery used for printing by means of plates, cylinders and other printing components of heading 8442) | 2.5% | 2.2% | 32.96 | 0.07% | 3.7 |
| '848690 | Parts and accessories for machines and apparatus of a kind used solely or principally for the manufacture of semiconductor boules or wafers, semiconductor devices, electronic integrated circuits or flat panel displays, and for machines and apparatus specified in note 9 C to chapter 84, n.e.s. | 2.0% | 1.2% | 26 | 0.11% | 0.02 |
| '843149 | Parts of machinery of heading 8426, 8429 and 8430, n.e.s. | 2.0% | 1.1% | 358.27 | 1.47% | 20.4 |
| Total of top 10 commodities | 44.6% | 3719.95 | 34.91 | |||
| Rest of the commodities under HS code 84 | 55.4% | 19,901 | 557 | |||
| HS 30 - Pharmaceuticals | ||||||
| '300490 | Medicaments consisting of mixed or unmixed products for therapeutic or prophylactic purposes, put up in measured doses "incl. those in the form of transdermal administration" or in forms or packings for retail sale (excluding medicaments containing antibiotics, medicaments containing hormones or steroids used as hormones, but not containing antibiotics, medicaments containing alkaloids or derivatives thereof but not containing hormones or antibiotics and medicaments containing provitamins, vitamins or derivatives thereof used as vitamins) | 51% | 48.6% | 12410.94 | 4.2% | 18.05 |
| '300215 | Immunological products, put up in measured doses or in forms or packings for retail sale | 26% | 15.6% | 127.88 | 0.1% | 0.05 |
| Total of top 2 commodities | 77% | 12,538.82 | 18.1 | |||
| Rest of the commodities under HS code 30 | 23% | 16,340 | 114 | |||
| HS 87 - Vehicles & Auto-components | ||||||
| '870323 | Motor cars and other motor vehicles principally designed for the transport of persons, incl. station wagons and racing cars, with spark-ignition internal combustion reciprocating piston engine of a cylinder capacity > 1.500 cm³ but <= 3.000 cm³ (excluding vehicles for the transport of persons on snow and other specially designed vehicles of subheading 8703.10) | 17.2% | 18.4% | 1767.59 | 0.7% | 0.2 |
| '870332 | Motor cars and other motor vehicles principally designed for the transport of persons, incl. station wagons and racing cars, with compression-ignition internal combustion piston engine "diesel or semi-diesel engine" of a cylinder capacity > 1.500 cm³ but <= 2.500 cm³ (excluding vehicles for the transport of persons on snow and other specially designed vehicles of subheading 8703.10) | 10.0% | 7.1% | 179.23 | 0.2% | 0.7 |
| '870324 | Motor cars and other motor vehicles principally designed for the transport of persons, incl. station wagons and racing cars, with spark-ignition internal combustion reciprocating piston engine of a cylinder capacity > 3.000 cm³ (excluding vehicles for the transport of persons on snow and other specially designed vehicles of subheading 8703.10) | 8.5% | 5.9% | 1.85 | 0.0% | 0 |
| '870322 | Motor cars and other motor vehicles principally designed for the transport of persons, incl. station wagons and racing cars, with spark-ignition internal combustion reciprocating piston engine of a cylinder capacity > 1.000 cm³ but <= 1.500 cm³ (excluding vehicles for the transport of persons on snow and other specially designed vehicles of subheading 8703.10) | 7.5% | 7.9% | 2795.49 | 2.6% | 8.1 |
| '870870 | Road wheels and parts and accessories thereof, for tractors, motor vehicles for the transport of ten or more persons, motor cars and other motor vehicles principally designed for the transport of persons, motor vehicles for the transport of goods and special purpose motor vehicles, n.e.s. | 5.6% | 1.3% | 125.18 | 0.7% | 0.7 |
| '870829 | Parts and accessories of bodies for tractors, motor vehicles for the transport of ten or more persons, motor cars and other motor vehicles principally designed for the transport of persons, motor vehicles for the transport of goods and special purpose motor vehicles (excluding bumpers and parts thereof and safety seat belts) | 5.4% | 5.2% | 151.37 | 0.2% | 0.3 |
| '870840 | Gear boxes and parts thereof, for tractors, motor vehicles for the transport of ten or more persons, motor cars and other motor vehicles principally designed for the transport of persons, motor vehicles for the transport of goods and special purpose motor vehicles, n.e.s | 4.5% | 4.6% | 387.71 | 0.6% | 6.1 |
| '870899 | Parts and accessories, for tractors, motor vehicles for the transport of ten or more persons, motor cars and other motor vehicles principally designed for the transport of persons, motor vehicles for the transport of goods and special purpose motor vehicles, n.e.s. | 4.5% | 5.9% | 2510.34 | 3.0% | 114.8 |
| '870895 | Safety airbags with inflator system and parts thereof, for tractors, motor vehicles for the transport of ten or more persons, motor cars and other motor vehicles principally designed for the transport of persons, motor vehicles for the transport of goods and special purpose motor vehicles, n.e.s. | 3.5% | 0.7% | 42.02 | 0.4% | 0 |
| Total of top 9 commodities | 66.6% | 7960.781 | 30.9 | |||
| Rest of the commodities under HS code 87 | 33.4% | 16,229 | 441 | |||
| HS 29 – Organic Chemicals | ||||||
| '293499 | Nucleic acids and their salts, whether or not chemically defined; heterocyclic compounds (excluding with oxygen only or with nitrogen hetero-atom[s] only, compounds containing in the structure an unfused thiazole ring or a benzothiazole or phenothiazine ring-system, not further fused and aminorex "INN", brotizolam "INN", clotiazepam "INN", cloxazolam "INN", dextromoramide "INN", haloxazolam "INN", ketazolam "INN", mesocarb "INN", oxazolam "INN", pemoline "INN", phendimetrazine "INN", phenmetrazine "INN", sufentanil "INN", and salts thereof, and inorganic or organic compounds of mercury whether or not chemically defined, and products of 3002 10) | 9.7% | 4.2% | 516.03 | 3.0% | 4 |
| '290919 | Acyclic ethers and their halogenated, sulphonated, nitrated or nitrosated derivatives (excluding diethyl ether) | 6.7% | 1.3% | 101.60 | 1.6% | 0.03 |
| '293349 | Heterocyclic compounds with nitrogen hetero-atom[s] only, containing in the structure a quinoline or isoquinoline ring-system, whether or not hydrogenated, but not further fused (excluding levorphanol "INN" and its salts, and inorganic or organic compounds of mercury) | 4.5% | 0.4% | 149.52 | 11.7% | 0 |
| '293399 | Heterocyclic compounds with nitrogen hetero-atom[s] only (excluding those containing an unfused pyrazole, imidazole, pyridine or triazine ring, whether or not hydrogenated, a quinoline or isoquinoline ring-system, not further fused, whether or not hydrogenated, a pyrimidine ring, whether or not hydrogenated, or piperazine ring in the structure, and lactams, alprazolam "INN", camazepam "INN", chlordiazepoxide "INN", clonazepam "INN", clorazepate, delorazepam "INN", diazepam "INN", estazolam "INN", ethyl loflazepate "INN", fludiazepam "INN", flunitrazepam "INN", flurazepam "INN", halazepam "INN", lorazepam "INN", lormetazepam "INN", mazindol "INN", medazepam "INN", midazolam "INN", nimetazepam "INN", nitrazepam "INN", nordazepam "INN", oxazepam "INN", pinazepam "INN", prazepam "INN", pyrovalerone "INN", temazepam "INN", tetrazepam "INN" and triazolam "INN", and salts thereof) | 3.5% | 3.8% | 863.44 | 5.6% | 3.2 |
| '290511 | Methanol "methyl alcohol" | 3.3% | 2.4% | 4.41 | 0.0% | 0.05 |
| '293339 | Heterocyclic compounds with nitrogen hetero-atom[s] only, containing an unfused pyridine ring, whether or not hydrogenated, in the structure (excluding pyridine, piperidine, alfentanil "INN", anileridine "INN", bezitramide "INN", bromazepam "INN", difenoxin "INN", diphenoxylate "INN", dipipanone "INN", fentanyl "INN", ketobemidone "INN", methylphenidate "INN", pentazocine "INN", pethidine "INN", pethidine "INN" intermediate A, phencyclidine "INN" "PCP", phenoperidine "INN", pipradol "INN", piritramide "INN", propiram "INN", trimeperidine "INN", and salts thereof, and inorganic or organic compounds of mercury) | 3.2% | 3.3% | 664.24 | 5.1% | 37.3 |
| '292249 | Amino-acids and their esters; salts thereof (excluding those with > one kind of oxygen function, lysine and its esters, and salts thereof, and glutamic acid, anthranilic acid, tilidine "INN", and salts thereof) | 3.2% | 1.6% | 192.47 | 2.7% | 9.1 |
| '293359 | Heterocyclic compounds with nitrogen hetero-atom[s] only, containing a pyrimidine ring, whether or not hydrogenated, or piperazine ring in the structure (excluding malonylurea "barbituric acid" and its derivatives, allobarbital "INN", amobarbital "INN", barbital "INN", butalbital "INN", butobarbital "INN", cyclobarbital "INN", methylphenobarbital "INN", pentobarbital "INN", phenobarbital "INN", secbutabarbital "INN", secobarbital "INN", vinylbital "INN", loprazolam "INN", mecloqualone "INN", methaqualone "INN" and zipeprol "INN", and salts thereof) | 3.2% | 5.1% | 371.10 | 1.8% | 4.5 |
| '293590 | Sulphonamides (excl. perfluorooctane sulphonamides) | 2.9% | 2.6% | 239.66 | 2.4% | 1.4 |
| '293190 | Separate chemically defined organo-inorganic compounds (excluding organo-sulphur compounds and those of mercury, tetramethyl lead, tetraethyl lead and tributyltin compounds) | 1.9% | 1.0% | 151.45 | 4.4% | 0.07 |
| '293499 | Nucleic acids and their salts, whether or not chemically defined; heterocyclic compounds (excluding with oxygen only or with nitrogen hetero-atom[s] only, compounds containing in the structure an unfused thiazole ring or a benzothiazole or phenothiazine ring-system, not further fused and aminorex "INN", brotizolam "INN", clotiazepam "INN", cloxazolam "INN", dextromoramide "INN", haloxazolam "INN", ketazolam "INN", mesocarb "INN", oxazolam "INN", pemoline "INN", phendimetrazine "INN", phenmetrazine "INN", sufentanil "INN", and salts thereof, and inorganic or organic compounds of mercury whether or not chemically defined, and products of 3002 10) | 9.7% | 4.2% | 516.03 | 3.0% | 4 |
| '290919 | Acyclic ethers and their halogenated, sulphonated, nitrated or nitrosated derivatives (excluding diethyl ether) | 6.7% | 1.3% | 101.60 | 1.6% | 0.03 |
| '293349 | Heterocyclic compounds with nitrogen hetero-atom[s] only, containing in the structure a quinoline or isoquinoline ring-system, whether or not hydrogenated, but not further fused (excluding levorphanol "INN" and its salts, and inorganic or organic compounds of mercury) | 4.5% | 0.4% | 149.52 | 11.7% | 0 |
| Total of top 10 commodities | 42.2% | 3253.91 | 59.65 | |||
| Rest of the commodities under HS code 29 | 57.8% | 17,829 | 438.7 | |||
| HS 39 – Plastic and articles there of | ||||||
| '392690 | Articles of plastics and articles of other materials of heading 3901 to 3914, n.e.s (excluding goods of 9619) | 16.1% | 10.4% | 549.41 | 0.8% | 17.6 |
| '392321 | Sacks and bags, incl. cones, of polymers of ethylene | 7.9% | 1.8% | 159.84 | 1.3% | 0.4 |
| '390761 | Poly"ethylene terephthalate", in primary forms, having a viscosity number of >= 78 ml/g | 5.9% | 1.3% | 789.21 | 8.6% | 0.08 |
| '392620 | Articles of apparel and clothing accessories produced by the stitching or sticking together of plastic sheeting, incl. gloves, mittens and mitts (excluding goods of 9619) | 3.4% | 1.0% | 7.06 | 0.1% | 0.04 |
| '392062 | Plates, sheets, film, foil and strip, of non-cellular poly"ethylene terephthalate", not reinforced, laminated, supported or similarly combined with other materials, without backing, unworked or merely surface-worked or merely cut into squares or rectangles (excluding those of poly"methyl methacrylate", self-adhesive products, and floor, wall and ceiling coverings of heading 3918) | 3.0% | 1.4% | 333.60 | 3.9% | 25.3 |
| '392010 | Plates, sheets, film, foil and strip, of non-cellular polymers of ethylene, not reinforced, laminated, supported or similarly combined with other materials, without backing, unworked or merely surface-worked or merely cut into squares or rectangles (excluding self-adhesive products, and floor, wall and ceiling coverings of heading 3918) | 2.9% | 2.5% | 81.52 | 0.5% | 1.4 |
| '390810 | Polyamides-6, -11, -12, -6,6, -6,9, -6,10 or -6,12, in primary forms | 2.7% | 1.8% | 14.65 | 0.1% | 0.1 |
| '390140 | Ethylene-alpha-olefins copolymers, having a specific gravity of < 0,94 , in primary forms | 2.4% | 2.3% | 66.57 | 0.5% | 0.3 |
| '390799 | Saturated polyesters in primary forms (excluding polycarbonates, alkyd resins, poly"ethylene terephthalate" and poly"lactic acid") | 2.3% | 1.5% | 41.48 | 0.5% | 0.2 |
| '390230 | Propylene copolymers, in primary forms | 2.2% | 2.3% | 35.04 | 0.2% | 0.002 |
| Total of top 10 commodities | 48.7% | 2078.38 | 45.42 | |||
| Rest of the commodities under HS code 39 | 51.3% | 7277 | 243 | |||
| HS 71 – Gems and Jewelry | ||||||
| '711021 | Palladium, unwrought or in powder form | 19.4% | 2.8% | 6.17 | 0.03% | 0 |
| '711299 | Waste and scrap of silver, incl. metal clad with silver, and other waste and scrap containing silver or silver compounds, of a kind used principally for the recovery of precious metal (excluding ash, and waste and scrap of precious metals melted down into unworked blocks, ingots or similar forms) | 14.8% | 1.7% | 124.27 | 1.41% | 0.3 |
| '711319 | Articles of jewellery and parts thereof, of precious metal other than silver, whether or not plated or clad with precious metal (excluding articles > 100 years old) | 12.1% | 11.2% | 9884.70 | 10.77% | 341.7 |
| '711292 | Waste and scrap of platinum, incl. metal clad with platinum, and other waste and scrap containing platinum or platinum compounds, of a kind used principally for the recovery of precious metal (excluding ash containing platinum or platinum compounds, waste and scrap of platinum melted down into unworked blocks, ingots, or similar forms, and sweepings and ash containing precious metals) | 10.9% | 1.2% | 0.98 | 0.02% | 0.1 |
| '711031 | Rhodium, unwrought or in powder form | 8.0% | 1.2% | 0.70 | 0.01% | 0.05 |
| '711011 | Platinum, unwrought or in powder form | 7.4% | 1.4% | 2.76 | 0.04% | 0.5 |
| Total of top 6 commodity | 72.7% | 10,019.59 | 342.65 | |||
| Rest of the commodities under HS code 71 | 27.3% | 33,779 | 519 | |||
| HS 72 & 73 – Iron and Steel Articles | ||||||
| '730890 | Structures and parts of structures, of iron or steel, n.e.s. (excluding bridges and bridge-sections, towers and lattice masts, doors and windows and their frames, thresholds for doors, props and similar equipment for scaffolding, shuttering, propping or pit-propping) | 12.7% | 4.9% | 482.87 | 1.3% | 11.5 |
| '732690 | Articles of iron or steel, n.e.s. (excluding cast articles or articles of iron or steel wire) | 9.6% | 7.0% | 731.42 | 1.7% | 281.8 |
| '720241 | Ferro-chromium, containing by weight > 4% of carbon | 5.6% | 1.0% | 773.64 | 12.3% | 0 |
| '721049 | Flat-rolled products of iron or non-alloy steel, of a width of >= 600 mm, hot-rolled or cold-rolled "cold-reduced", not corrugated, plated or coated with zinc (excluding electrolytically plated or coated with zinc) | 4.3% | 3.3% | 349.64 | 1.6% | 0.1 |
| '720221 | Ferro-silicon, containing by weight > 55% of silicon | 3.8% | 0.5% | 24.93 | 0.8% | 0.02 |
| '731815 | Threaded screws and bolts, of iron or steel, whether or not with their nuts and washers (excluding coach screws and other wood screws, screw hooks and screw rings, self-tapping screws, lag screws, stoppers, plugs and the like, threaded) | 2.8% | 2.7% | 280.16 | 1.5% | 1.8 |
| '720851 | Flat-rolled products of iron or non-alloy steel, of a width >= 600 mm, not in coils, simply hot-rolled, not clad, plated or coated, of a thickness of > 10 mm, without patterns in relief | 2.0% | 1.5% | 214.97 | 2.3% | 0.03 |
| '720230 | Ferro-silico-manganese | 2.0% | 0.5% | 692.16 | 22.3% | 0.4 |
| '720917 | Flat-rolled products of iron or non-alloy steel, of a width of >= 600 mm, in coils, simply cold-rolled "cold-reduced", not clad, plated or coated, of a thickness of >= 0,5 mm but <= 1 mm | 1.8% | 0.9% | 159.45 | 2.8% | 0.01 |
| '720839 | Flat-rolled products of iron or non-alloy steel, of a width of >= 600 mm, in coils, simply hot-rolled, not clad, plated or coated, of a thickness of < 3 mm, not pickled, without patterns in relief | 1.6% | 2.3% | 1442.37 | 10.7% | 0 |
| Total of top 10 commodities | 46.1% | 5151.60 | 295.66 | |||
| Rest of the commodities under HS code 72 & 73 | 53.9% | 16,994 | 631 | |||
| HS 61 & 62 - Apparels | ||||||
| '611030 | Jerseys, pullovers, cardigans, waistcoats and similar articles, of man-made fibres, knitted or crocheted (excluding wadded waistcoats) | 8.9% | 5.5% | 68.66 | 0.3% | 2.5 |
| '611020 | Jerseys, pullovers, cardigans, waistcoats and similar articles, of cotton, knitted or crocheted (excluding wadded waistcoats) | 5.2% | 5.9% | 170.27 | 0.7% | 16.9 |
| '610910 | T-shirts, singlets and other vests of cotton, knitted or crocheted | 4.7% | 6.6% | 1727.53 | 5.7% | 41.8 |
| '610990 | T-shirts, singlets and other vests of textile materials, knitted or crocheted (excluding cotton) | 3.9% | 3.1% | 601.76 | 4.0% | 14.4 |
| '620193 | Men's or boys' anoraks, windcheaters, wind jackets and similar articles, of man-made fibres (not knitted or crocheted and excluding suits, ensembles, jackets, blazers, trousers and tops of ski suits) | 3.2% | 2.3% | 4.69 | 0.1% | 0.08 |
| '620343 | Men's or boys' trousers, bib and brace overalls, breeches and shorts of synthetic fibres (excluding knitted or crocheted, underpants and swimwear) | 2.9% | 1.8% | 90.87 | 1.2% | 3.9 |
| '620342 | Men's or boys' trousers, bib and brace overalls, breeches and shorts, of cotton (excluding knitted or crocheted, underpants and swimwear) | 2.9% | 5.6% | 439.43 | 1.8% | 10.9 |
| '620462 | Women's or girls' trousers, bib and brace overalls, breeches and shorts of cotton (excluding knitted or crocheted, panties and swimwear) | 2.8% | 4.4% | 196.43 | 1.0% | 19.6 |
| '620463 | Women's or girls' trousers, bib and brace overalls, breeches and shorts of synthetic fibres (excluding knitted or crocheted, panties and swimwear) | 2.3% | 1.5% | 119.75 | 1.9% | 34.9 |
| '621210 | Brassieres of all types of textile materials, whether or not elasticated, incl. knitted or crocheted | 2.0% | 2.3% | 93.14 | 0.9% | 0.7 |
| Total of top 10 commodities | 38.9% | 3512.53 | 145.68 | |||
| Rest of the commodities under HS code 61 & 62 | 61.1% | 14,710 | 1620 | |||
| HS 94 - Furnitures | ||||||
| '940190 | Parts of seats, n.e.s. | 15.9% | 13.4% | 65.15 | 0.2% | 7.3 |
| '940360 | Wooden furniture (excluding for offices, kitchens and bedrooms, and seats) | 14.0% | 10.4% | 540.27 | 2.1% | 33 |
| '940490 | Articles of bedding and similar furnishing, fitted with springs or stuffed or internally filled with any material or of cellular rubber or plastics (excluding mattress supports, mattresses, sleeping bags, pneumatic or water mattresses and pillows, blankets and covers) | 13.0% | 4.3% | 462.34 | 4.0% | 87.5 |
| '940161 | Upholstered seats, with wooden frames (excluding convertible into beds) | 7.8% | 7.6% | 17.21 | 0.1% | 0.2 |
| '940320 | Metal furniture (excluding for offices, seats and medical, surgical, dental or veterinary furniture) | 7.1% | 7.1% | 133.61 | 0.8% | 14.2 |
| '940390 | Parts of furniture, n.e.s. (excluding of seats and medical, surgical, dental or veterinary furniture) | 6.2% | 5.8% | 30.14 | 0.2% | 6.3 |
| '940540 | Electric lamps and lighting fittings, n.e.s. | 4.8% | 7.3% | 33.88 | 0.1% | 2.6 |
| Total of top 7 commodities | 68.7% | 1282.59 | 151.1 | |||
| Rest of the commodities under HS code 94 | 31.3% | 1772 | 242 | |||
