Australia is a USD 1.5 Trillion economy. The country is home to 2.5 million residents , with a high consumption potential. Australia has witnessed one of the longest periods of continuous annual growth amongst the developed nations of the world . On an average, the household consumption expenditure amounts to approximately 55% of the GDP, indicating a large consumption market. Australia is also home to 2.41 lakh Non-resident Indians (NRIs) and 2.55 lakh Persons of Indian origin (PIOs).

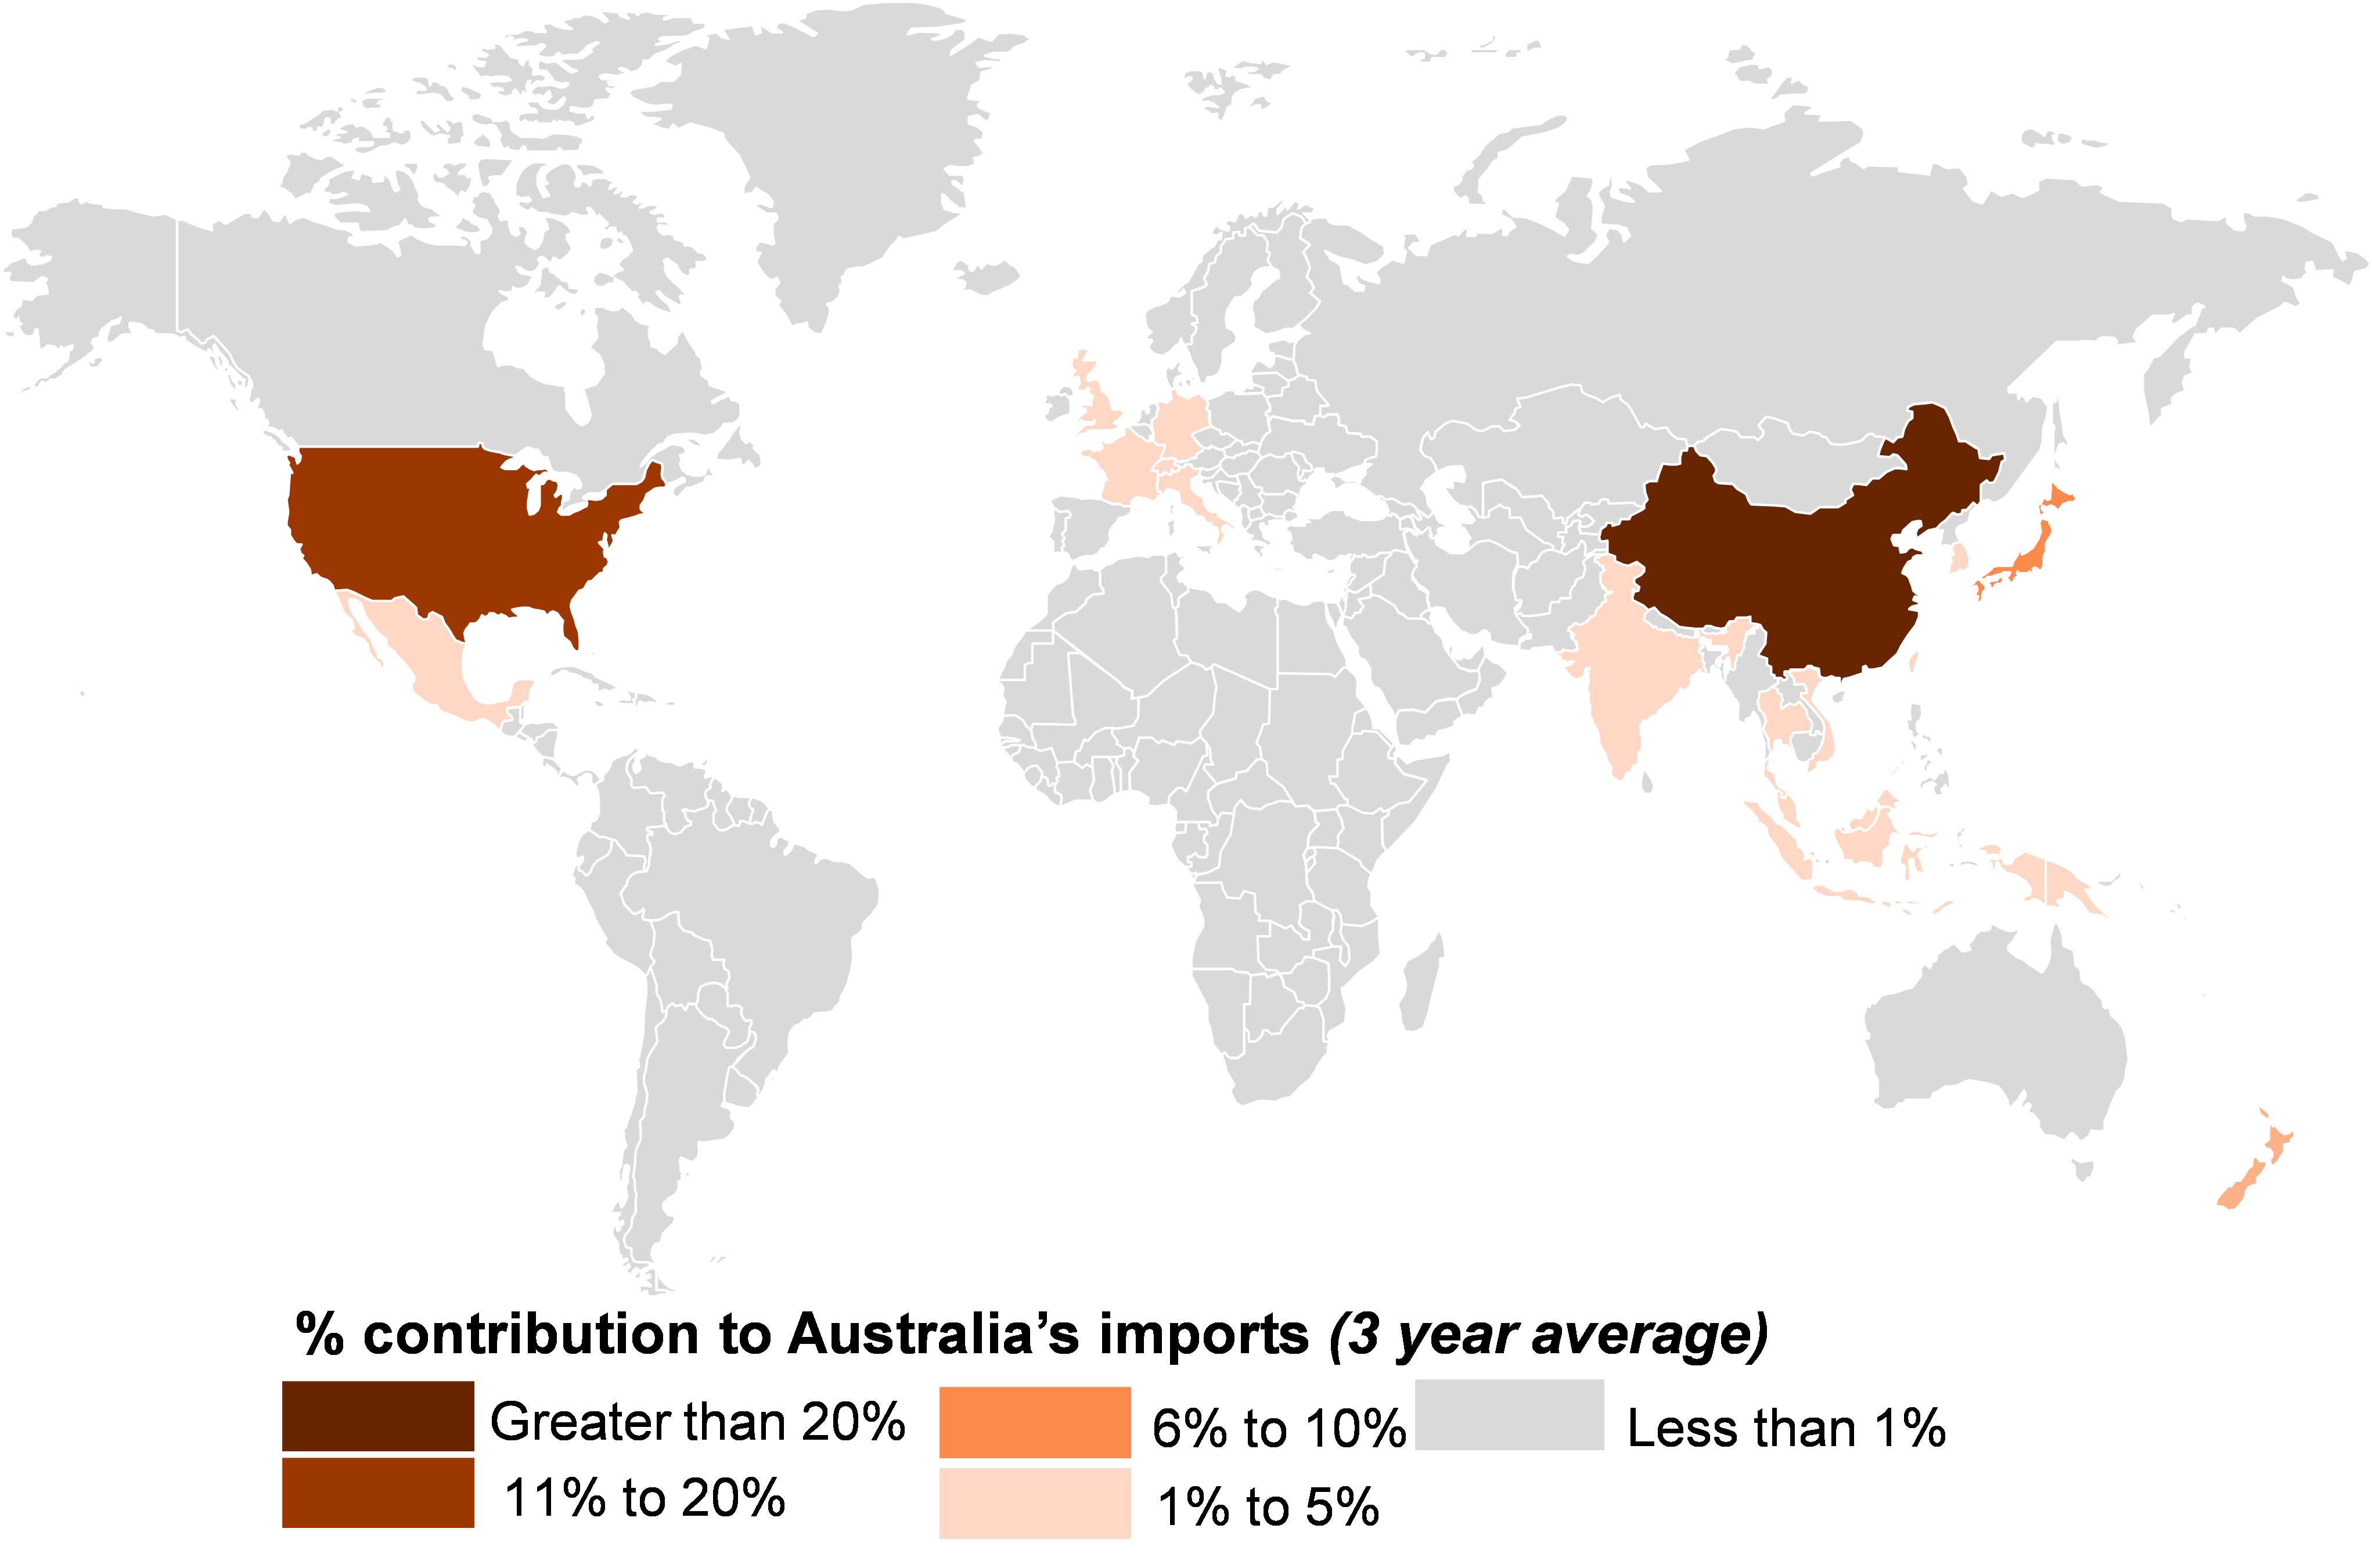
Australia is a USD 200 Bn import market, which is largely serviced by exporters from China, USA, SE-Asia and India. Australia’s imports have grown from USD 189 Bn in 2016 to USD 228 Bn in 2018, contracting back to USD 202 Bn in 2020 owing to COVID induced lockdown.
Australia’s imports are largely sourced from Asian exporters. China contributes to 26% of imports to Australia. The top 10 countries contributing approximately 70% of imports to Australia are China, USA, Japan, Thailand, Germany, Malaysia, South Korea, Singapore, New Zealand and United Kingdom. India is the 14th largest exporter to Australia. India contributes to 1.7% of Australia’s imports. A detailed list of key countries exporting to Australia is attached in annexure 01.
Australia has several active trade agreements with different economies for strengthening economic partnership and bilateral trade. India and Australia also announced to conclude an interim trade agreement in March 2022 and a Comprehensive Economic Cooperation Agreement (CECA) after 12-18 months. The India – Australia CECA shall open up multi-faceted opportunities for India’s exporters to diversify in the Australian geography and scale up exports.
Australia has a diverse consumer demand. Of the USD 200+ Billion import demand, the leading sectors that contribute to 70% of Australia’s imports are Machinery & equipment, Electricals & electronics, Vehicles, auto-components, mineral fuels, pharmaceuticals, Apparels, Gems and Jewellery, Plastics & its articles, Furniture and Optical, photographic & Cinematographic devices. A detailed list of sectors is attached in Annexure 2.

Australia is a USD 91 Billion market for services sector imports. The key sectors contributing to 90% of Australia’s service sector imports are listed in the table below. Services imports to Australia have been growing gradually at a CAGR of ~2.5%. Travel, transportation, financial and engineering services are the key sectors being imported in Australia
| Key services being imported in Australia | |||
|---|---|---|---|
| Code | Service Label | Average exports (USD Mn) | % share |
| Total (3 year average) | 91,751 | 100% | |
| 4.2.3 | Travel, Personal, Other (other than health and education) | 32,31 | 35% |
| SOX1 | Memo item: Other commercial services | 20,416 | 22% |
| 3a.2 | Freight transport, All modes (alternative breakdown) | 7,061 | 8% |
| 3a.1 | Passenger transport, All modes (alternative breakdown) | 5,366 | 6% |
| 10.2.1 | Legal, accounting, management consulting, and public relations services | 4,794 | 5% |
| 4.1 | Travel, Business | 3,209 | 3% |
| 7 | Financial services | 2148 | 2% |
| 8.3 | Licenses to reproduce and/or distribute computer software | 1,986 | 2% |
| 10.3.5 | Other business services n.i.e. | 1,982 | 2% |
| 9.2 | Computer services | 1,829 | 2% |
| 10.3.1 | Architectural, engineering, scientific, and other technical services | 1,306 | 1% |
| Others | 9,344 | 10% | |
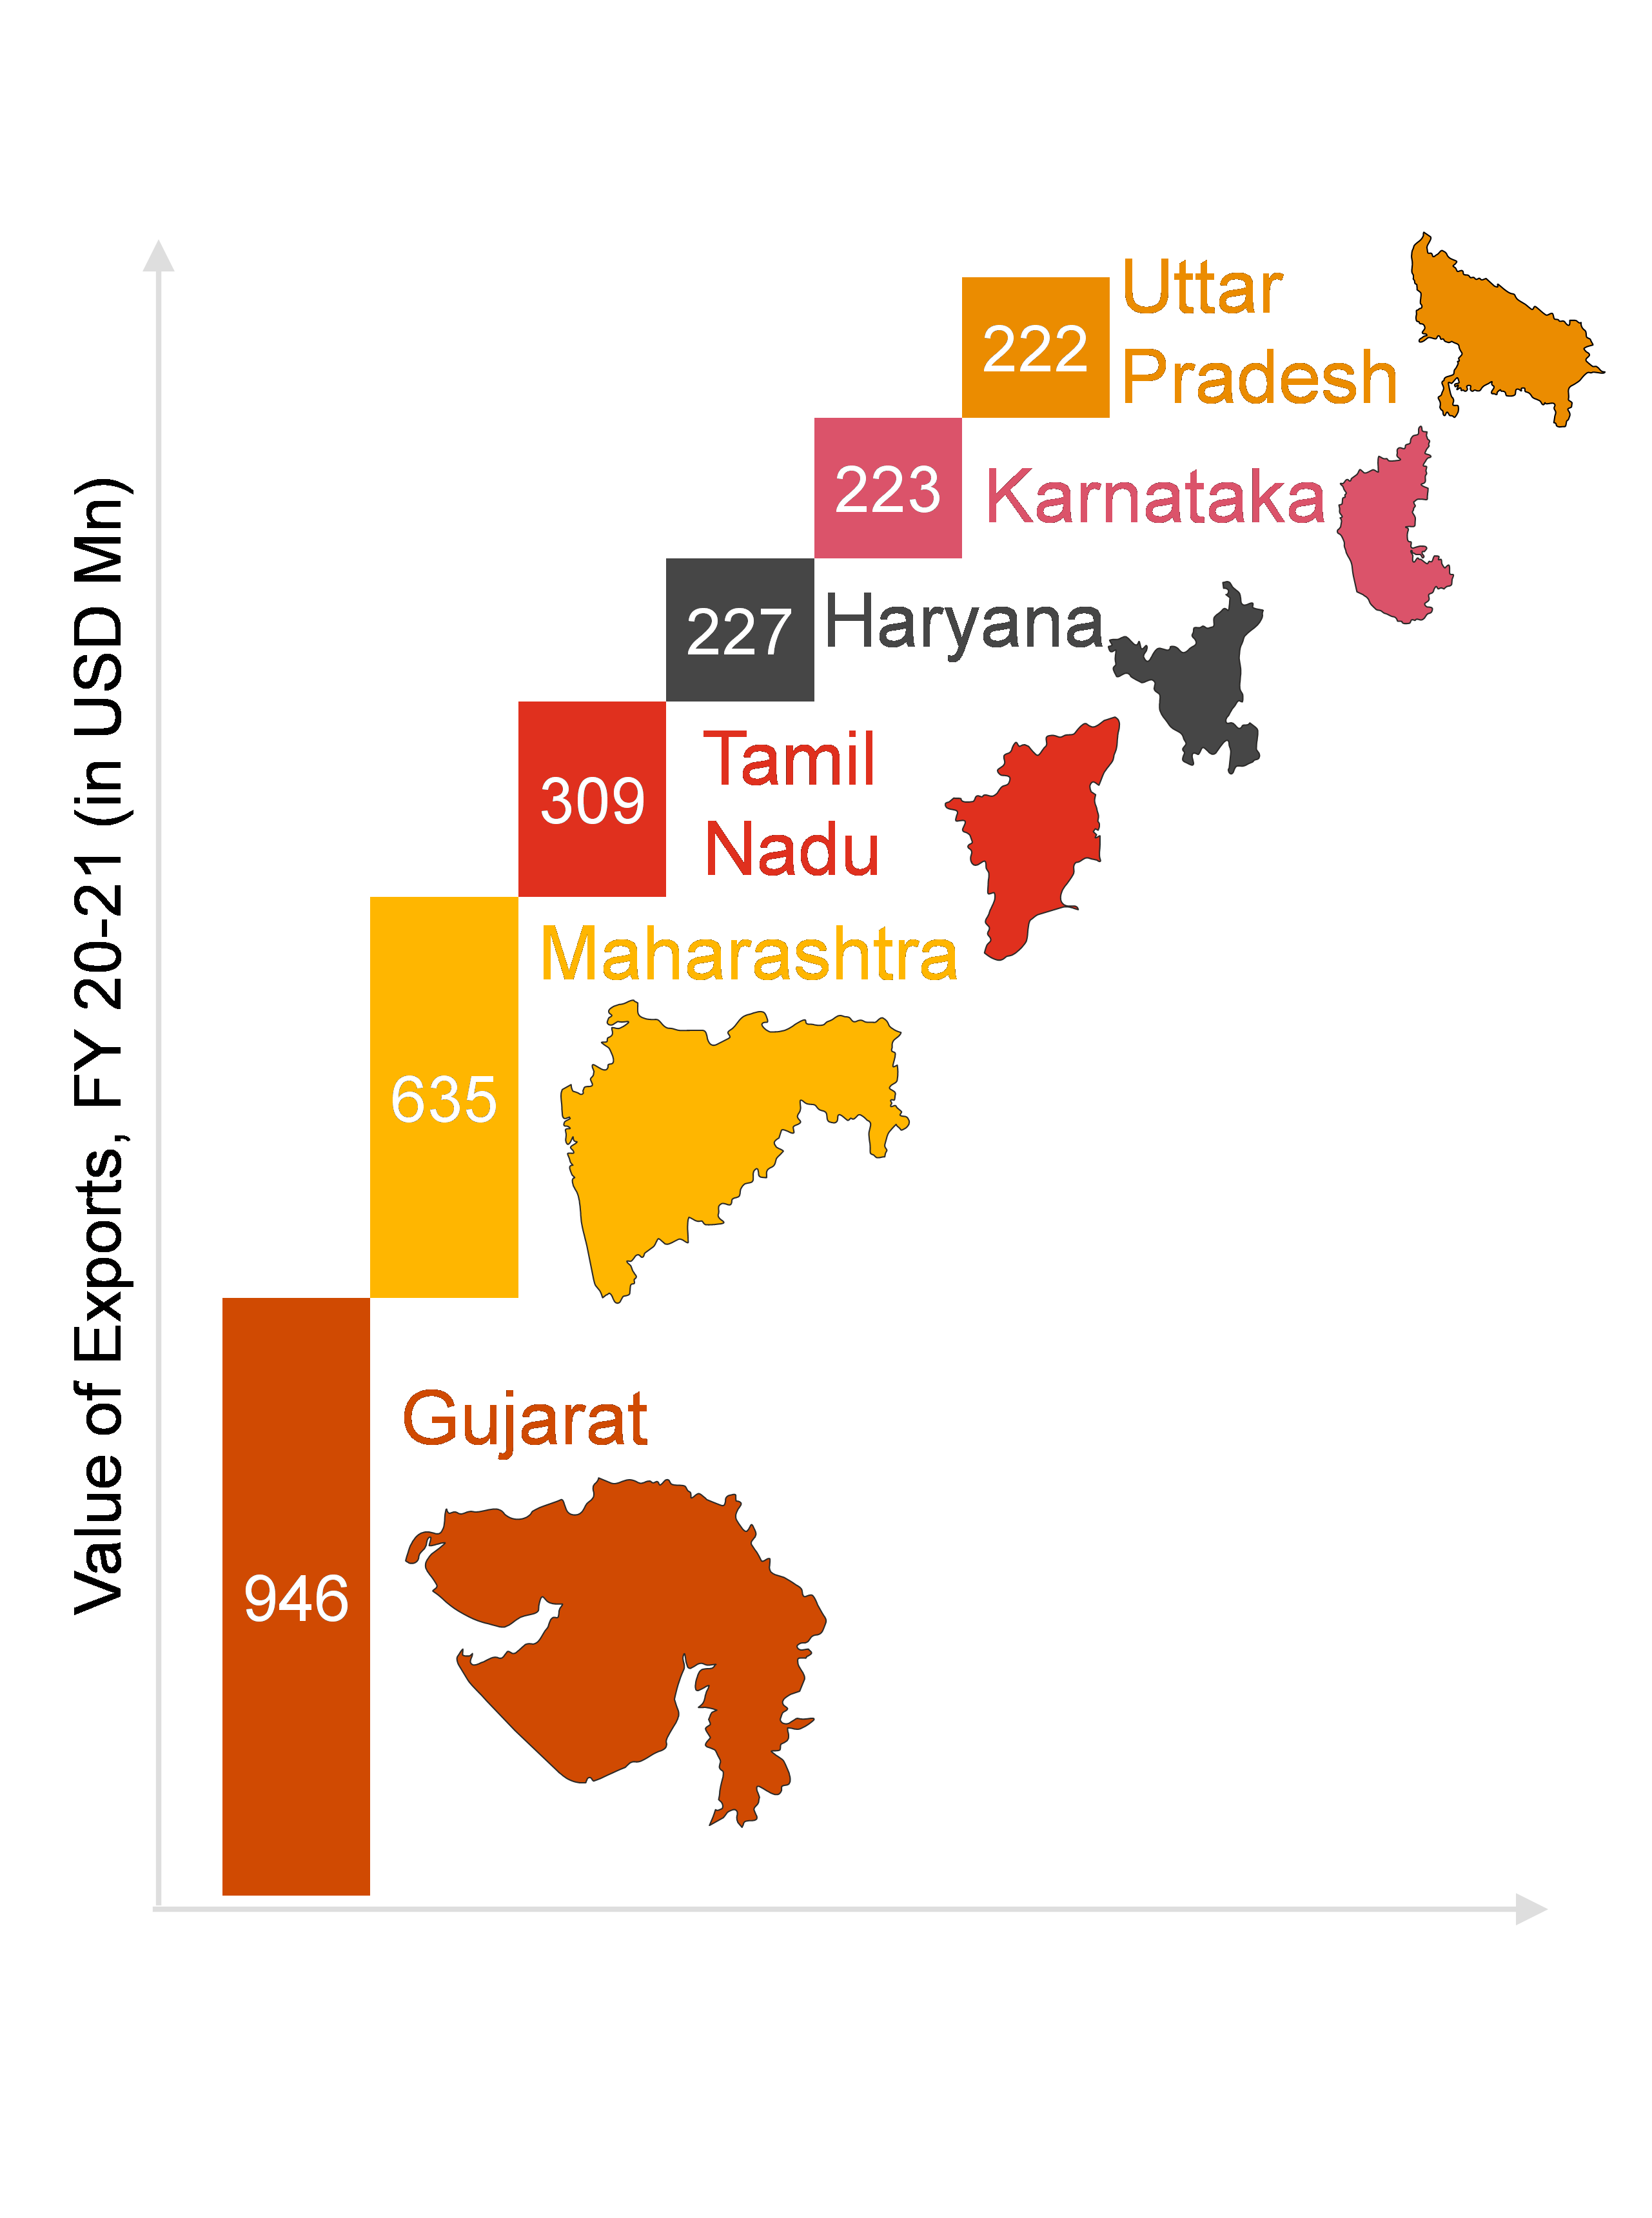
India maintained an approximate share of 1.7% in Australia’s import market, exporting an average of USD 3.66 Billion in the last years. India’s share in Australia’s imports have grown from 1.72% in 2016 to 1.82% in 2020. Gujarat, Maharashtra, Tamil Nadu, Haryana, Karnataka and Uttar Pradesh are the top 6 states contributing approximately 60% of India’s exports to Australia.
India’s exports to Australia are largely characterized by exports from top 10 sectors like, Mineral fuels & oils, gems & Jewellery, pharmaceuticals, machinery, equipment & locomotives, apparels & textiles, electricals & electronics, articles of iron & steel, organic chemicals, etc. The table below summarizes the key sectors contributing to 60% of India’s exports to Australia. The table also discusses the percentage share of the key sectors in India’s exports to Australia and the contribution of India’s exports in Australia’s total imports of that sector at a HS 2 level. The sectors highlighted in yellow are the key sectors identified for driving exports growth from Uttar Pradesh.
| Top sectors contributing to 60% of India’s exports to Australia | |||
|---|---|---|---|
| Sector | India’s exports to Australia, (USD Mn) | % share of sector in India’s exports to Australia | % share of India’s exports to Australia’s imports |
| HS 27, Mineral Fuels & its products | 703 | 19% | 2.83% |
| HS 71, Gems & Jewellery | 324 | 9% | 4.43% |
| HS 30, Pharmaceuticals | 310 | 8% | 3.68% |
| HS 84, Machinery & Equipment | 218 | 6% | 0.7% |
| HS 61 & 62, Apparels | 215 | 6% | 3.3% |
| HS 86, Locomotives and their parts | 189 | 5% | 18.33% |
| HS 85, Electricals & electronics | 172 | 5% | 0.7% |
| HS 63, Made up textile articles | 136 | 4% | 7.32% |
| HS 73, Articles of Iron & Steel | 121 | 3% | 2.59% |
| HS 29, Organic Chemicals | 111 | 3% | 4.77% |
| Total exports (3 year average) | USD 3,662 Mn | ||
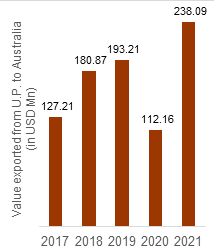
The exports from Uttar Pradesh to Australia grew at a CAGR of 17% in the last 4 years. UP’s exports to Australia contracted by ~42% owing to COVID-19 induced effects on the global supply chains. However, in 2021, the exports sprung back to the growth trend accelerating by more than 100% as compared to 2020 export levels. Uttar Pradesh exported a total of USD 238 Million value of commodities to Australia in 2021. Thus, the high CAGR rates and strong rebound from COVID related contraction indicates a potential for growth in the Australian market
15 select sectors contributes to 75% of UP’s exports to Australia during the last 3 years. Export growth rate of 11 select sectors in Australia is higher than the growth rate of UP’s exports in all markets, thus acting as the drivers of Uttar Pradesh’s export growth in Australia. The table below summarizes the top 15 products exported from UP to Australia:
| Top commodities exported from UP to Australia | |||||
|---|---|---|---|---|---|
| HS code | Product description | Value of Exports (in USD Mn) | % share in UP’s exports to Australia | Growth rate of exports from UP to Australia | Growth rate of exports from UP to all markets |
| 62 | Apparels, not knitted or crocheted | 31 | 14.37% | 21% | 1% |
| 57 | Carpets | 20 | 9.36% | 12% | 1% |
| 42 | Leather goods | 20 | 9.33% | 22% | 3% |
| 44 | Wood & articles of wood | 11 | 5.10% | 58% | 27% |
| 63 | Other made-up textile articles | 10 | 4.59% | 36% | 5% |
| 64 | Footwear | 10 | 4.53% | 5% | -7% |
| 84 | Machinery and Equipment | 10 | 4.30% | 57% | 9% |
| 73 | Articles of Iron & Steel | 8 | 3.90% | 1% | 10% |
| 95 | Toys, games & sports equipment | 7 | 3.38% | 28% | 21% |
| 21 | Misc. edible preparations | 7 | 3.14% | 35% | 14% |
| 85 | Electricals & electronics | 7 | 3.13% | 17% | 76% |
| 87 | Vehicles & auto-components | 6 | 2.85% | 23% | 11% |
| 94 | Furniture | 6 | 2.81% | 27% | 33% |
| 83 | Articles of base metal | 6 | 2.74% | 26% | 20% |
| 10 | Cereals | 6 | 2.62% | -15% | 25% |
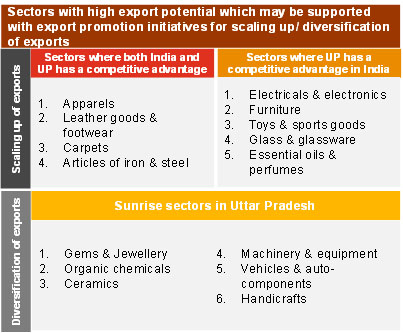
Uttar Pradesh’s export capabilities resonates with consumer demands in Australia. The priority sectors are classified based on their RCA scores to identify the relevant export promotion strategies. The traditional sectors for which UP has a competitive advantage are selected for scaling up globally. Similarly, the sunrise sectors are selected for product development and market diversification to boost exports as shown in Figure 6. Also, the state government has shortlisted products with a high export potential for each district of the state under the ‘Districts as Export Hubs’ initiative.
Australia and India relaunched the dialogues on a Comprehensive Economic Cooperation Agreement (CECA) and may shortly sign an interim agreement. The India-Australia CECA may potentially create opportunities for scaling up of trade between India and Australia by improving trade cost competitiveness of Indian firms exporting to Australia. To further tap on to the potential trade opportunities in the Australian market, select sectors are identified based on their import demand in Australia, India’s exports to Australia and UP’s exports to Australia. The priority sectors shortlisted are classified into two categories, based on relevant strategy for export promotion. The sectors with significant manufacturing and exports volume to Australia are strategically selected for scaling up of exports. The sectors with appreciable manufacturing volume, but low level of exports from UP to Australia are selected for market diversification into Australia. Table 4 summarizes the top 10 sectors shortlisted for UP’s exporters for exporting to Australia. Apparels, Articles of iron & steel, leather goods and footwear sectors are shortlisted for scaling up of exports. Similarly, Machinery & equipment, Vehicles & auto-components, Electricals & electronics, made-up textiles, toys, games & sports equipment and furniture sectors are shortlisted for market diversification into Australia. A comprehensive detail for the select 10 sectors at a HS 6 level is described in annexure 3. The export trends are analyzed to identify country level strategies for export promotion as described in table 3. Further, to support exporters of the state in scaling of exports, the government of Uttar Pradesh through Export Promotion Bureau – Uttar Pradesh and Uttar Pradesh Export Promotion Council has planned to undertake the following initiatives: 1. Identifying and connecting with Sectoral bodies (for priority sectors) based in Australia 2. Identifying importers and their sourcing needs 3. List of key events where UP's exporters shall participate 4. Facilitate visit of Australian Importers to UP in key trade events that may be organized by Government of Uttar Pradesh 5. Identification of online platforms where UP's exporters should register for exporting their products to meet sourcing requirements of Australian importers
| Potential sectors for driving UP’s exports growth in Australia | |||||
|---|---|---|---|---|---|
| HS Code | Product Description | Value imported by Australia (USD Mn) | Exports from India to Australia (USD Mn) | UP’s exports to Australia (USD Mn) | Potential intervention strategy |
| 84 | Machinery and Equipment | 31,050 | 218 | 2.5 | Diversification |
| 87 | Vehicles & auto-components | 26,843 | 104 | 3.6 | Diversification |
| 85 | Electricals & electronics | 24,773 | 172 | 3.7 | Diversification |
| 61 & 62 | Apparels | 6,490 | 215 | 24.6 | Scaling up |
| 73 | Articles of Iron & Steel | 4,669 | 121 | 7.4 | Scaling up |
| 94 | Furniture | 4,688 | 51 | 3.6 | Diversification |
| 95 | Toys, games & sports equipment | 2,545 | 21 | 3.9 | Diversification |
| 63 | Other made-up textile articles | 1,856 | 136 | 5.8 | Diversification |
| 64 | Footwear | 1,656 | 28 | 9.8 | Scaling up |
| 42 | Leather goods | 1,383 | 78 | 13.5 | Scaling up |
| Exporters | Imported value in 2018 | Imported value in 2019 | Imported value in 2020 | 3 year average | % share |
|---|---|---|---|---|---|
| Total | 227,704 | 214,274 | 202,277 | 214,752 | 100% |
| China | 55,166 | 54,665 | 57,621 | 55,817 | 26% |
| United States of America | 23,316 | 25,136 | 23,747 | 24,066 | 11% |
| Japan | 16,778 | 14,901 | 12,087 | 14,589 | 7% |
| Thailand | 10,909 | 10,101 | 9,595 | 10,202 | 5% |
| Germany | 11,165 | 10,100 | 9,324 | 10,196 | 5% |
| Malaysia | 9,736 | 7,579 | 6,705 | 8,007 | 4% |
| Korea, Republic of | 9,516 | 8,045 | 6,025 | 7,862 | 4% |
| Singapore | 8,597 | 7,071 | 5,248 | 6,972 | 3% |
| New Zealand | 5,844 | 5,395 | 4,951 | 5,397 | 3% |
| United Kingdom | 5,402 | 5,000 | 4,791 | 5,064 | 2% |
| Italy | 5,216 | 4,870 | 4,557 | 4,881 | 2% |
| Viet Nam | 4,510 | 4,144 | 4,296 | 4,317 | 2% |
| France | 3,975 | 4,219 | 4,008 | 4,067 | 2% |
| India | 4,074 | 3,229 | 3,683 | 3,662 | 2% |
| Taipei, Chinese | 3,124 | 3,345 | 3,161 | 3,210 | 1% |
| Indonesia | 3,557 | 3,444 | 3,153 | 3,384 | 2% |
| Papua New Guinea | 2,703 | 2,851 | 2,371 | 2,642 | 1% |
| Switzerland | 2,718 | 2,460 | 2,334 | 2,504 | 1% |
| Mexico | 2,323 | 2,178 | 2,010 | 2,170 | 1% |
| Others | 31,865 | 30,021 | 28,764 | 30,217 | 14% |
| HS Code | Product Description | Imported value in 2018 | Imported value in 2019 | Imported value in 2020 | 3 year average | 3% share |
|---|---|---|---|---|---|---|
| Total | All products | 227,704 | 214,274 | 202,277 | 214,752 | 100% |
| '84 | Machinery and mechanical appliances | 31,929 | 30,666 | 30,555 | 31,050 | 14% |
| '85 | Electrical machinery and equipment and parts thereof; electronics, etc. | 25,722 | 24,580 | 24,018 | 24,773 | 12% |
| '87 | Vehicles, other than railway or tramway rolling stock, and parts and accessories thereof | 30,074 | 26,687 | 23,768 | 26,843 | 12% |
| '27 | Mineral fuels, mineral oils and products of their distillation | 30,413 | 27,153 | 17,015 | 24,860 | 12% |
| '30 | Pharmaceutical products | 8,176 | 8,378 | 8,742 | 8,432 | 4% |
| '71 | Gems & Jewellery | 6,603 | 6,623 | 8,685 | 7,304 | 3% |
| '90 | Optical, photographic, cinematographic, measuring, checking, precision, medical or surgical equipment | 8,340 | 8,119 | 8,019 | 8,160 | 4% |
| '39 | Plastics and articles thereof | 6,410 | 5,848 | 6,159 | 6,139 | 3% |
| '94 | Furniture, and furnishing items like, bedding, mattresses, cushions and similar stuffed articles | 4,826 | 4,561 | 4,678 | 4,688 | 2% |
| '73 | Articles of iron or steel | 5,055 | 4,496 | 4,455 | 4,669 | 2% |
| '62 | Articles of apparel and clothing accessories, not knitted or crocheted | 3,347 | 3,372 | 3,321 | 3,347 | 2% |
| '40 | Rubber and articles thereof | 3,222 | 3,175 | 3,146 | 3,181 | 1% |
| '61 | Articles of apparel and clothing accessories, knitted or crocheted | 3,214 | 3,226 | 2,990 | 3,143 | 1% |
| '63 | Other made-up textile articles; sets; worn clothing and worn textile articles; rags | 1,464 | 1,385 | 2,721 | 1,856 | 1% |
| '95 | Toys, games and sports requisites; parts and accessories thereof | 2,534 | 2,401 | 2,700 | 2,545 | 1% |
| '88 | Aircraft, spacecraft, and parts thereof | 1,544 | 2,272 | 2,452 | 2,089 | 1% |
| '29 | Organic chemicals | 2,434 | 2,186 | 2,365 | 2,328 | 1% |
| '38 | Miscellaneous chemical products | 1,868 | 1,677 | 2,359 | 1,968 | 1% |
| '21 | Miscellaneous edible preparations | 1,886 | 2,232 | 2,237 | 2,118 | 1% |
| '48 | Paper and paperboard; articles of paper pulp, of paper or of paperboard | 2,184 | 2,054 | 1,958 | 2,065 | 1% |
| '33 | Essential oils and resinoids; perfumery, cosmetic or toilet preparations | 2,050 | 2,057 | 1,893 | 2,000 | 1% |
| '22 | Beverages, spirits and vinegar | 1,886 | 1,915 | 1,833 | 1,878 | 1% |
| '76 | Aluminium and articles thereof | 2,002 | 1,877 | 1,788 | 1,889 | 1% |
| '99 | Commodities not elsewhere specified | 4,364 | 3,109 | 1,638 | 3,037 | 1% |
| '19 | Preparations of cereals, flour, starch or milk; pastrycooks' products | 1,382 | 1,445 | 1,544 | 1,457 | 1% |
| '44 | Wood and articles of wood; wood charcoal | 1,941 | 1,584 | 1,498 | 1,674 | 1% |
| '31 | Fertilizers | 1,447 | 1,521 | 1,466 | 1,478 | 1% |
| '64 | Footwear, gaiters and the like; parts of such articles | 1,739 | 1,781 | 1,448 | 1,656 | 1% |
| '72 | Iron and steel | 1,702 | 1,252 | 1,179 | 1,378 | 1% |
| '42 | Articles of leather; saddlery and harness; travel goods, handbags | 1,532 | 1,452 | 1,166 | 1,384 | 1% |
| Others | 26,414 | 25,191 | 24,481 | 25,362 | 12% |
| HS Code (6 digit) | Product Description | Share in Australia’s import at the HS 2 level | Average share in global imports at HS2 level | Global exports by India | Global exports by India | Global exports by Uttar Pradesh |
|---|---|---|---|---|---|---|
| HS 84 – Machinery, mechanical appliances and equipment | ||||||
| '847130 | Data-processing machines, automatic, portable, weighing <= 10 kg, consisting of at least a central processing unit, a keyboard and a display (excluding peripheral units) | 12% | 7% | 35.22 | 0.02% | 0.53 |
| '847150 | Processing units for automatic data-processing machines, whether or not containing in the same housing one or two of the following types of unit: storage units, input units, output units (excluding those of heading 8471.41 or 8471.49 and excluding peripheral units) | 5% | 4% | 46.16 | 0.06% | 0.43 |
| '848180 | Appliances for pipes, boiler shells, tanks, vats or the like (excluding pressure-reducing valves, valves for the control of pneumatic power transmission, check "non-return" valves and safety or relief valves) | 3% | 3% | 821.51 | 821.51 | 821.51 |
| '843149 | Parts of machinery of heading 8426, 8429 and 8430, n.e.s. | 3% | 1% | 327.83 | 1.41% | 17.39 |
| '842952 | Self-propelled mechanical shovels, excavators and shovel loaders, with a 360° revolving superstructure | '2% | 1% | 129.58 | 0.60% | 1.86 |
| '847989 | Machines and mechanical appliances, n.e.s. | 2% | 2% | 376.83 | 0.83% | 6.45 |
| '847170 | Storage units for automatic data-processing machines | 2% | 4% | 23.83 | 0.03% | 0.08 |
| '841590 | Parts of air conditioning machines, comprising a motor-driven fan and elements for changing the temperature and humidity, n.e.s. | 2% | 1% | 75.27 | 0.38% | 2.49 |
| '842951 | Self-propelled front-end shovel loaders | 2% | 0.5% | 65.09 | 0.65% | 0.00 |
| '842890 | Machinery for lifting, handling, loading or unloading, n.e.s. | 1% | 1% | 74.96 | 0.61% | 5.25 |
| Total of top 10 commodities | 34% | 1976.28 | 48.80 | |||
| Rest of the commodities under HS code | 84 66% | 17641.01 | 462.93 | |||
| HS 87 – Vehicles & Auto-components | ||||||
| 870323 | Motor cars and other motor vehicles principally designed for the transport of persons, incl. station wagons and racing cars, with spark-ignition internal combustion reciprocating piston engine of a cylinder capacity > 1.500 cm³ but <= 3.000 cm³ (excluding vehicles for the transport of persons on snow and other specially designed vehicles of subheading 8703.10) | 26.88% | 2.69% | 1681.85 | 0.69% | 0.15 |
| '870421 | Motor vehicles for the transport of goods, with compression-ignition internal combustion piston engine "diesel or semi-diesel engine" of a gross vehicle weight <= 5 t (excluding dumpers for off-highway use of subheading 8704.10 and special purpose motor vehicles of heading 8705) | 17.15% | 7.67% | 198.98 | 0.40% | 0.24 |
| '870333 | Motor cars and other motor vehicles principally designed for the transport of persons, incl. station wagons and racing cars, with compression-ignition internal combustion piston engine "diesel or semi-diesel engine" of a cylinder capacity > 2.500 cm³ (excluding vehicles for the transport of persons on snow and other specially designed vehicles of subheading 8703.10) | 8.00% | 7.60% | 6.42 | 0.03% | 0.22 |
| '870324 | Motor cars and other motor vehicles principally designed for the transport of persons, incl. station wagons and racing cars, with spark-ignition internal combustion reciprocating piston engine of a cylinder capacity > 3.000 cm³ (excluding vehicles for the transport of persons on snow and other specially designed vehicles of subheading 8703.10) | 5.44% | 1.71% | 2.10 | 0.00% | 0.00 |
| '870322 | Motor cars and other motor vehicles principally designed for the transport of persons, incl. station wagons and racing cars, with spark-ignition internal combustion reciprocating piston engine of a cylinder capacity > 1.000 cm³ but <= 1.500 cm³ (excluding vehicles for the transport of persons on snow and other specially designed vehicles of subheading 8703.10) | 4.99% | 1.12% | 2562.69 | 2.47% | 2.45 |
| '870332 | Motor cars and other motor vehicles principally designed for the transport of persons, incl. station wagons and racing cars, with compression-ignition internal combustion piston engine "diesel or semi-diesel engine" of a cylinder capacity > 1.500 cm³ but <= 2.500 cm³ (excluding vehicles for the transport of persons on snow and other specially designed vehicles of subheading 8703.10) | 4.42% | 1.24% | 130.90 | 0.15% | 0.05 |
| Total of top 6 commodities | 66.87% | 4582.94 | 3.12 | |||
| Rest of the commodities under HS code 87 | 33.13% | 10621.76 | 372.00 | |||
| HS 85 – Electricals & electronics | ||||||
| '851712 | Telephones for cellular networks "mobile telephones" or for other wireless networks | 16.04% | 1.42% | 3197.38 | 1.22% | 1742.61 |
| '851762 | Machines for the reception, conversion and transmission or regeneration of voice, images or other data, incl. switching and routing apparatus (excluding telephone sets, telephones for cellular networks or for other wireless networks) | 14.14% | 2.02% | 537.45 | 0.34% | 4.23 |
| '854140 | Photosensitive semiconductor devices, incl. photovoltaic cells whether or not assembled in modules or made up into panels; light emitting diodes (excluding photovoltaic generators) | 5.45% | 2.28% | 195.48 | 0.34% | 8.00 |
| '850440 | Static converters | 4.05% | 1.55% | 1121.97 | 1.79% | 10.64 |
| '852872 | Reception apparatus for television, colour, whether or not incorporating radio-broadcast receivers or sound or video recording or reproducing apparatus, designed to incorporate a video display or screen | 3.85% | 2.13% | 4.63 | 0.01% | 0.82 |
| '852580 | Television cameras, digital cameras and video camera recorders | 2.71% | 1.78% | 69.10 | 0.20% | 8.21 |
| '851830 | Headphones and earphones, whether or not combined with microphone, and sets consisting of a microphone and one or more loudspeakers (excluding telephone sets, hearing aids and helmets with built-in headphones, whether or not incorporating a microphone) | 2.32% | 2.90% | 5.93 | 0.04% | 0.40 |
| '853710 | Boards, cabinets and similar combinations of apparatus for electric control or the distribution of electricity, for a voltage <= 1.000 V | 2.04% | 0.83% | 430.53 | 0.71% | 15.20 |
| '851770 | Parts of telephone sets, telephones for cellular networks or for other wireless networks and of other apparatus for the transmission or reception of voice, images or other data, n.e.s. | 1.94% | 0.37% | 315.77 | 0.24% | 62.21 |
| '852852 | Monitors capable of directly connecting to and designed for use with an automatic data processing machine of heading 8471 (excl. CRT, with TV receiver) | 1.91% | 2.15% | 5.64 | 0.03% | 0.07 |
| Total of top 10 commodities | 54.46% | 5883.88 | 1852.38 | |||
| Rest of the commodities under HS code 85 | 45.54% | 8318.95 | 458.15 | |||
| HS 61 & 62 - Apparels | ||||||
| '610910 | T-shirts, singlets and other vests of cotton, knitted or crocheted | 7.52% | 1.79% | 1698.93 | 5.65% | 39.54 |
| '621010 | Garments made up of felt or nonwovens, whether or not impregnated, coated, covered or laminated (excluding babies' garments and clothing accessories) | 5.12% | 3.40% | 44.54 | 0.51% | 1.46 |
| '620342 | Men's or boys' trousers, bib and brace overalls, breeches and shorts, of cotton (excluding knitted or crocheted, underpants and swimwear) | 5.09% | 1.51% | 438.26 | 1.83% | 9.32 |
| '611030 | Jerseys, pullovers, cardigans, waistcoats and similar articles, of man-made fibres, knitted or crocheted (excluding wadded waistcoats) | 4.35% | 1.29% | 67.01 | 0.29% | 2.69 |
| '611020 | Jerseys, pullovers, cardigans, waistcoats and similar articles, of cotton, knitted or crocheted (excluding wadded waistcoats) | 4.19% | 1.13% | 168.24 | 0.72% | 14.95 |
| '620462 | Women's or girls' trousers, bib and brace overalls, breeches and shorts of cotton (excluding knitted or crocheted, panties and swimwear) | 4.11% | 1.54% | 195.03 | 1.03% | 19.04 |
| '610990 | T-shirts, singlets and other vests of textile materials, knitted or crocheted (excluding cotton) | 2.89% | 1.57% | 565.96 | 3.98% | 12.40 |
| '620520 | Men's or boys' shirts of cotton (excluding knitted or crocheted, nightshirts, singlets and other vests) | 2.89% | 2.10% | 669.10 | 7.17% | 6.28 |
| '620443 | Women's or girls' dresses of synthetic fibres (excluding knitted or crocheted and petticoats) | 2.41% | 2.35% | 574.45 | 7.52% | 178.82 |
| '621210 | Brassieres of all types of textile materials, whether or not elasticated, incl. knitted or crocheted | 2.39% | 1.70% | 85.91 | 0.87% | 0.80 |
| Total of top 10 commodities | 40.96% | 4507.43 | 285.30 | |||
| Rest of the commodities under HS code 61 & 62 | 59.04% | 6673.63 | 1192.93 | |||
| HS 73 – Articles of Iron & Steel | ||||||
| '730890 | Structures and parts of structures, of iron or steel, n.e.s. (excluding bridges and bridge-sections, towers and lattice masts, doors and windows and their frames, thresholds for doors, props and similar equipment for scaffolding, shuttering, propping or pit-propping) | 16.25% | 2.22% | 482.35 | 1.31% | 10.99 |
| '732690 | Articles of iron or steel, n.e.s. (excluding cast articles or articles of iron or steel wire) | 13.20% | 1.27% | 714.92 | 1.65% | 251.10 |
| '731815 | Threaded screws and bolts, of iron or steel, whether or not with their nuts and washers (excluding coach screws and other wood screws, screw hooks and screw rings, self-tapping screws, lag screws, stoppers, plugs and the like, threaded) | 5.24% | 1.31% | 273.17 | 1.50% | 1.77 |
| '732111 | Appliances for baking, frying, grilling and cooking and plate warmers, for domestic use, of iron or steel, for gas fuel or for both gas and other fuels (excluding large cooking appliances) | 3.44% | 2.72% | 11.06 | 0.21% | 0.43 |
| '732111 | Appliances for baking, frying, grilling and cooking and plate warmers, for domestic use, of iron or steel, for gas fuel or for both gas and other fuels (excluding large cooking appliances) | 3.44% | 2.72% | 11.06 | 0.21% | 0.43 |
| '730630 | Tubes, pipes and hollow profiles, welded, of circular cross-section, of iron or non-alloy steel (excluding products having internal and external circular cross-sections and an external diameter of > 406,4 mm, or line pipe of a kind used for oil or gas pipelines or casing and tubing of a kind used in drilling for oil or gas) | 2.42% | 1.79% | 244.81 | 3.76% | 19.69 |
| '731210 | Stranded wire, ropes and cables, of iron or steel (excluding electrically insulated products and twisted fencing wire and barbed wire) | 2.38% | 1.72% | 97.86 | 1.62% | 0.31 |
| '730661 | Tubes and pipes and hollow profiles, welded, of square or rectangular cross-section, of iron or steel | 2.37% | 1.88% | 27.93 | 0.45% | 4.27 |
| '730799 | Tube or pipe fittings, of iron or steel (excluding cast iron or stainless steel products; flanges; threaded elbows, bends and sleeves; butt welding fittings) | 2.36% | 2.25% | 94.52 | 2.15% | 4.16 |
| '732393 | Table, kitchen or other household articles, and parts thereof, of stainless steel (excluding cans, boxes and similar containers of heading 7310; waste baskets; shovels, corkscrews and other articles of the nature of a work implement; articles of cutlery, spoons, ladles, forks etc. of heading 8211 to 8215; ornamental articles; sanitary ware) | 2.34% | 1.57% | 342.59 | 4.41% | 22.38 |
| Total of top 10 commodities | 52.42% | 2301.84 | 315.09 | |||
| Rest of the commodities under HS code 73 | 47.58% | 4449.24 | 159.70 | |||
| HS 94 – Furniture & furnishings | ||||||
| '940161 | Upholstered seats, with wooden frames (excluding convertible into beds) | 11.08% | 2.83% | 18.41 | 0.10% | 0.19 |
| '940360 | Wooden furniture (excluding for offices, kitchens and bedrooms, and seats) | 10.61% | 1.98% | 552.03 | 2.11% | 33.50 |
| '940320 | Metal furniture (excluding for offices, seats and medical, surgical, dental or veterinary furniture) | 9.01% | 2.44% | 145.35 | 0.80% | 14.40 |
| '940510 | Chandeliers and other electric ceiling or wall lighting fittings (excluding for lighting public open spaces or thoroughfares) | 8.68% | 2.54% | 52.89 | 0.29% | 15.58 |
| '940540 | Electric lamps and lighting fittings, n.e.s. | 7.81% | 2.14% | 37.60 | 0.15% | 3.20 |
| '940350 | Wooden furniture for bedrooms (excluding seats) | 6.42% | 2.63% | 13.60 | 0.13% | 0.15 |
| '940490 | Articles of bedding and similar furnishing, fitted with springs or stuffed or internally filled with any material or of cellular rubber or plastics (excluding mattress supports, mattresses, sleeping bags, pneumatic or water mattresses and pillows, blankets and covers) | 5.81% | 2.57% | 471.73 | 4.08% | 81.92 |
| '940390 | Parts of furniture, n.e.s. (excluding of seats and medical, surgical, dental or veterinary furniture) | 4.75% | 1.60% | 28.01 | 0.17% | 5.14 |
| '940171 | Chandeliers and other electric ceiling or wall lighting fittings (excluding for lighting public open spaces or thoroughfares) | 4.40% | 3.53% | 1.85 | 0.02% | 0.18 |
| Total of top 9 commodities | 68.57% | 1321.47 | 154.25 | |||
| Rest of the commodities under HS code 94 | 31.43% | 506.13 | 81.37 | |||
| HS 95 – Toys, games & sports goods | ||||||
| '950300 | Tricycles, scooters, pedal cars and similar wheeled toys; dolls' carriages; dolls; other toys; reduced-size scale" recreational models, working or not; puzzles of all kinds" | 41.80% | 2.17% | 130.00 | 0.25% | 4.97 |
| '950450 | Video game consoles and machines (excluding operated by any means of payment) | 15.07% | 1.86% | 0.95 | 0.00% | 0.00 |
| '950691 | Articles and equipment for general physical exercise, gymnastics or athletics | 11.53% | 2.62% | 19.44 | 0.16% | 1.86 |
| Total of top 3 commodities | 68.40% | 150.39 | 6.84 | |||
| Rest of the commodities under HS code 85 | 31.60% | 251.32 | 66.48 | |||
| HS 64 – Footwear | ||||||
| '640399 | Footwear with outer soles of rubber, plastics or composition leather, with uppers of leather (excluding covering the ankle, incorporating a protective metal toecap, sports footwear, orthopaedic footwear and toy footwear) | 25.76% | 1.49% | 277.56 | 1.06% | 93.70 |
| '640411 | Sports footwear, incl. tennis shoes, basketball shoes, gym shoes, training shoes and the like, with outer soles of rubber or plastics and uppers of textile materials | 16.87% | 1.48% | 132.99 | 0.86% | 3.11 |
| '640419 | Footwear with outer soles of rubber or plastics and uppers of textile materials (excluding sports footwear, incl. tennis shoes, basketball shoes, gym shoes, training shoes and the like, and toy footwear) | 14.35% | 1.03% | 77.90 | 0.32% | 5.99 |
| '640299 | Footwear with outer soles and uppers of rubber or plastics (excluding covering the ankle or with upper straps or thongs assembled to the sole by means of plugs, waterproof footwear of heading 6401, sports footwear, orthopaedic footwear and toy footwear) | 13.02% | 1.08% | 116.21 | 0.48% | 11.78 |
| Total of top 4 commodities | 70% | 604.44 | 114.58 | |||
| Rest of the commodities under HS code 64 | 30% | 1757.32 | 514.53 | |||
| HS 42 – Leather goods | ||||||
| '420292 | Travelling-bags, insulated food or beverage bags, toilet bags, rucksacks, shopping-bags, map-cases, tool bags, sports bags, jewellery boxes, cutlery cases, binocular cases, camera cases, musical instrument cases, gun cases, holsters and similar containers, with outer surface of plastic sheeting or textile materials (excluding trunks, briefcases, school satchels and similar containers, handbags and articles carried in the pocket or handbag) | 27.05% | 2.05% | 11.83 | 0.08% | 3.47 |
| '420221 | Handbags, whether or not with shoulder straps, incl. those without handles, with outer surface of leather, composition leather or patent leather | 22.28% | 1.90% | 357.06 | 2.37% | 37.24 |
| '420222 | Handbags, whether or not with shoulder straps, incl. those without handles, with outer surface of plastic sheeting or textile materials | 13.18% | 1.65% | 312.66 | 2.40% | 30.20 |
| '420212 | Trunks, suitcases, vanity cases, executive-cases, briefcases, school satchels and similar containers, with outer surface of plastics or textile materials | 8.06% | 1.69% | 46.48 | 0.43% | 2.12 |
| Total of top 4 commodities | 70.57% | 728.03 | 73.03 | |||
| Rest of the commodities under HS code 42 | 29.43% | 1456.52 | 237.92 | |||
| HS 57 – Carpets | ||||||
| '570330 | Carpets and other floor coverings, of man-made textile materials, tufted "needle punched", whether or not made up (excluding those of nylon or other polyamides) | 23.65% | 2.95% | 148.27 | 4.38% | 11.37 |
| '570320 | Carpets and other floor coverings, of nylon or other polyamides, tufted "needle punched", whether or not made up | 22.95% | 3.63% | 8.81 | 0.35% | 0.39 |
| '570310 | Carpets and other floor coverings, of wool or fine animal hair, tufted "needle punched", whether or not made up | 14.46% | 10.83% | 161.34 | 28.29% | 85.76 |
| '570242 | Carpets and other floor coverings, of man-made textile materials, woven, not tufted or flocked, of pile construction, made up (excluding Kelem, Schumacks, Karamanie and similar hand-woven rugs) | 7.42% | 1.06% | 40.97 | 1.38% | 5.70 |
| Total of top 4 commodities | 68.47% | 359.39 | 103.22 | |||
| Rest of the commodities under HS code 57 | 31.53% | 1342.25 | 357.71 | |||
