Mexico is a USD 1.2 Billion economy. The country is home to 127 million residents , with a high consumption potential. The GDP of the country has grown at a CAGR of 4% from USD 1.08 Trillion in 2016 to USD 1.27 Trillion in 2019. The GDP of 2020 saw a drop to USD 1.07 Trillion, because of the global pandemic that had a huge impacted on the global trade. On an average, the final consumption of the country has been steady at a rate of ~76% of the GDP for the period of 2017 to 2020.
Mexico is a USD 60 Bn import market, which is largely serviced by exporters from US and China. Mexico’s imports have grown at a CAGR of 4% from USD 387 Billion in 2016 to USD 455 Billion in 2019. It dropped to USD 383 Billion in 2020 due to the outbreak of the COVID, that led to disrupted global supply chains.
US is the largest exporter to the Mexican market with 45% of the total imports by Mexico. It is followed by China that accounts for 12% of the total imports by the Mexican market. The top 10 countries contributing approximately 85% of total imports by the country other than US and China are Japan, Germany, South Korea, Malaysia, Canada, Taipei, Brazil and Thailand. India is the 6th largest exporter to Mexico among the Asian countries. On an average, India contributes to 1.1% of Mexico’s imports. A detailed list of key countries exporting to Mexico is attached in annexure 01.
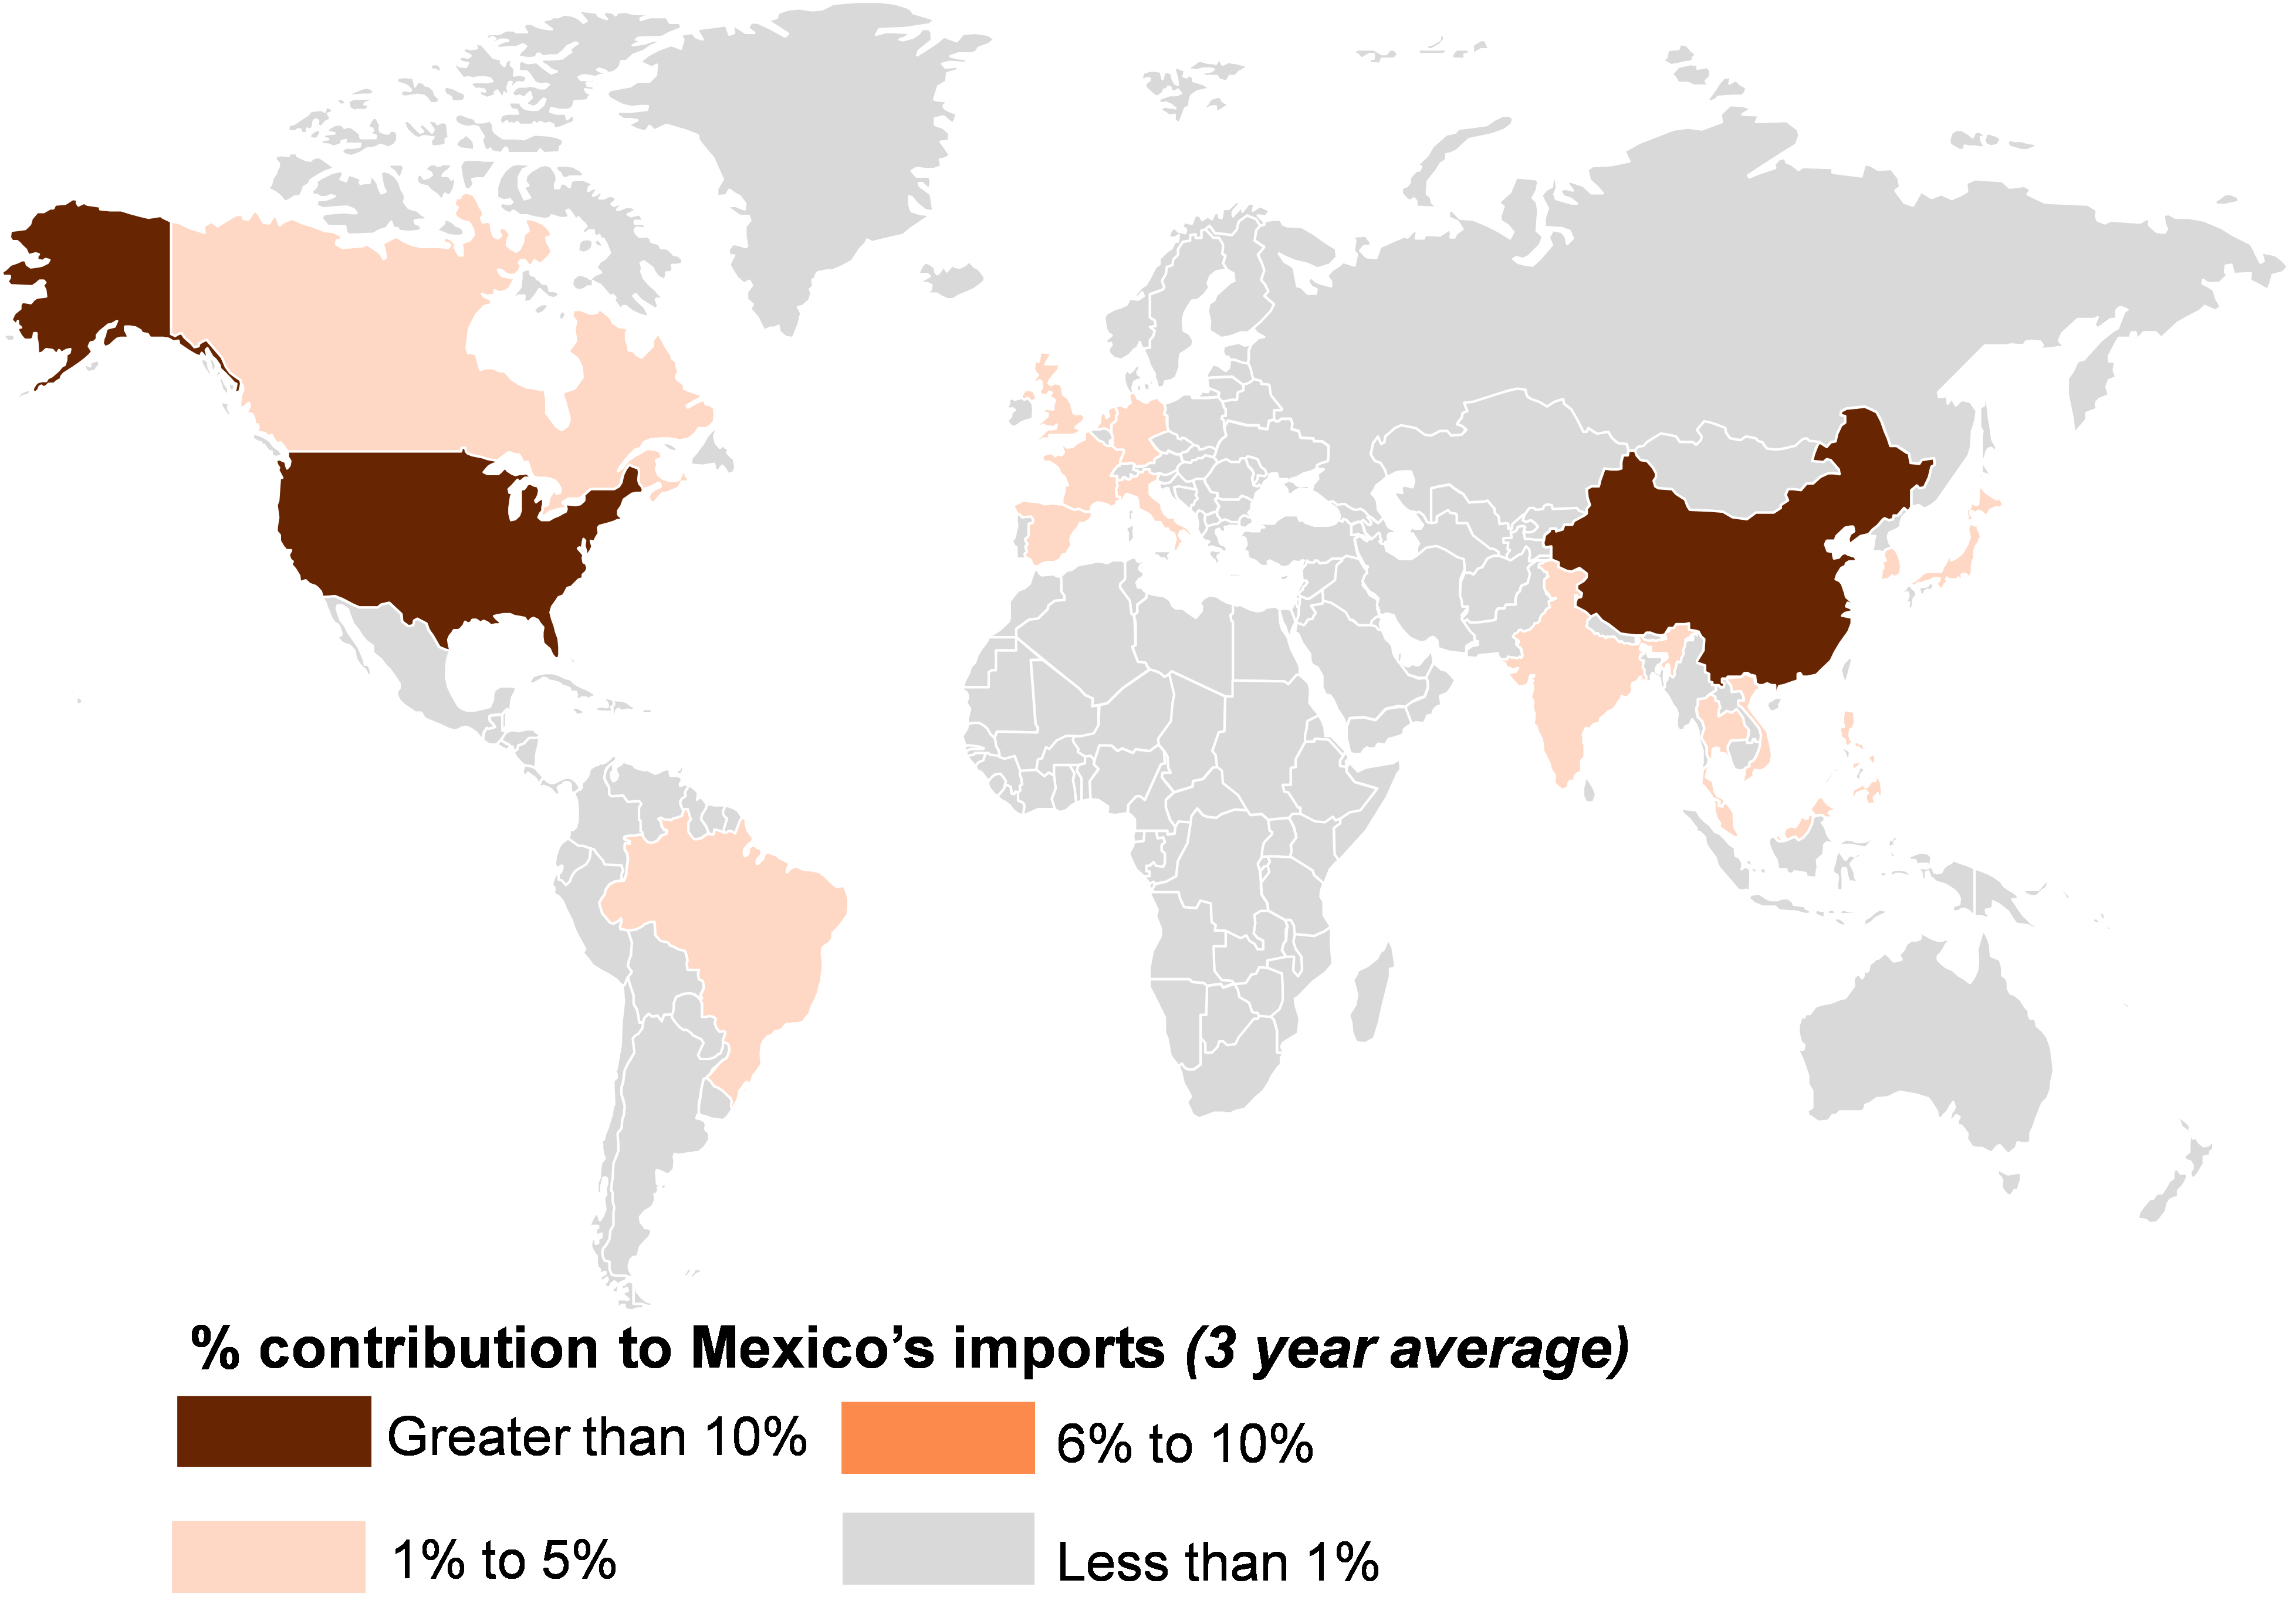
Mexico in general imports USD 60 Billion worth of products on an average basis. Of that the leading sectors that contribute to 74% of Mexico’s imports are Machinery & equipment, Vehicles & auto-components, Electricals & electronics, mineral fuels, Iron and steel articles, Plastics & its articles, and Optical, photographic devices, Organic Chemicals, Aluminum products and Rubber products. A detailed list of sectors is attached in Annexure 2.

| Table 1: Top service contributing to imports of Mexico | ||||||
|---|---|---|---|---|---|---|
| Code | Service Label | Imported value in 2018 | Imported value in 2019 | Imported value in 2020 | 3 year average | % share |
| 'TOTAL | All Service | 63,606 | 45,733 | 36,272 | 60,769 | 100% |
| 3a.2 | Freight transport, All modes (alternative breakdown) | 12,030 | 11,841 | 9,622 | 11,165 | s |
| SOX1 | Memo item: Other commercial services | 10,506 | 12,017 | 10,534 | 11,019 | 18% |
| 3.1.2 | Freight transport, Sea | 9,237 | 9,065 | 7,230 | 8,511 | 14% |
| 3.2.2 | Freight transport, Air | 2,793 | 2,777 | 2,392 | 2,654 | 4% |
| 10.3 | Technical, trade-related, and other business services | 2,197 | 1,988 | 2,158 | 2,114 | 3% |
| 3a.1 | Passenger transport, All modes (alternative breakdown) | 2,843 | 2,405 | 807 | 2,019 | 3% |
| 3.2.1 | Passenger transport, Air | 2,839 | 2,372 | 803 | 2,005 | 3% |
| 10.1 | Research and development (R&D) | 586 | 618 | 748 | 651 | 1% |
| 3a.3 | Other transport (other than passenger and freight), All modes (alternative breakdown) | 537 | 525 | 295 | 452 | 1% |
| 3.2.3 | Other transport, Air (other than passenger and freight) | 513 | 488 | 231 | 411 | 1% |
| 8 | Charges for the use of intellectual property n.i.e. | 302 | 313 | 329 | 315 | 1% |
| Total | 19,224 | 1,325 | 1,121 | 19,455 | 34% | |
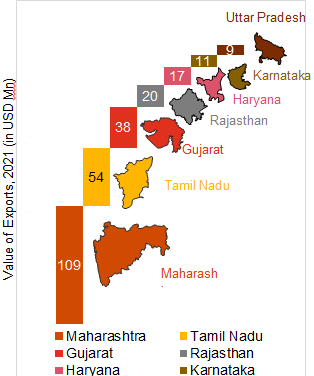
India exported ~ USD 4 Billion worth of products to Mexico in the year 2021, and exported on an average of USD 3.2 Billion worth of goods to Mexico per year for the period 209-2021. India’s share in the country’s imports has remain steady at 1.1% from 2018 to 2020., Maharashtra, Tamil Nadu, Gujarat, Rajasthan, Haryana, Karnataka, and Uttar Pradesh are the top 7 states of India in terms of exports to Mexico in 2021 of HS code 84.
India’s exports to Mexico are characterized by exports of the following top 10 sectors: Iron and steel, ceramic products, Machinery, electricals & electronics, vehicles & auto-components, organic chemicals, Aluminum products, Plastic articles, Pharmaceuticals, Tanning or dyeing extracts etc. as shown in table below. The table also discusses the percentage share of the sector in India’s exports to Mexico and the contribution of India’s exports in Mexico’s total imports of that sector at a HS 2 level. The sectors highlighted in yellow are the key sectors identified for driving exports growth from Uttar Pradesh.
| Table 2: Top sectors contributing to 83% of India’s exports to Mexico | ||||||||
|---|---|---|---|---|---|---|---|---|
| Sector | India’s exports to Mexico, (USD Mn) | % share of sector in India’s exports globally | % share of India’s exports to Mexico’s imports | |||||
| HS 87, Vehicles & Auto-components | 1271 | 4.9% | 39% | |||||
| HS 29, Organic Chemicals | 304 | 5.7% | 9% | |||||
| HS 76, Aluminium and articles | 214 | 2% | 7% | |||||
| HS 84, Machinery & Equipment | 203 | 6.4% | 6% | |||||
| HS 85, Electricals & Electronics | 176 | 4.7% | 5% | |||||
| HS 72 & 73, Iron and Steel | 182 | 6.5% | 5% | |||||
| HS 39, Plastics and articles | 91 | 2.3% | 3% | |||||
| HS 30, Pharmaceuticals | 90 | 5.3% | 3% | |||||
| HS 32, Tanning or dyeing extracts | 73 | 1% | 2% | |||||
| HS 69, Ceramic products | 66 | 0.6% | 2% | |||||
| Total exports (3 year average) | USD 3.2 Bn | |||||||
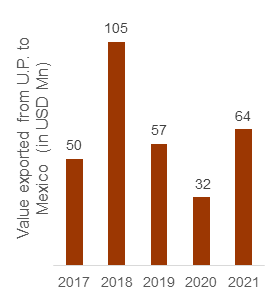
The exports from Uttar Pradesh to Mexico grew at a CAGR of 6% in the last 4 years. Uttar Pradesh exported a total of USD 64 Million worth of commodities to Mexico in 2021 which grew from USD 50 Million in 2017. The exports from UP to Mexico dropped to USD 32 Million in 2020 due to the Covid scenario but it rebounded back with 100% in 2021, indicating that the market has a high potential for growth in the future.
10 select sectors contributed to approximately 77% of UP’s exports to Mexico during the last 3 years. The sector marked with yellow has high export percentage than other products that are being imported by Mexico from UP. The table below summarizes the top 10 products exported from UP to Mexico:
| Top commodities exported from UP to Mexico | |||||
|---|---|---|---|---|---|
| HS code | Product description | Value of Exports by UP (in USD Mn) | % share in UP’s exports to Mexico | Growth rate of exports from UP to Mexico | Growth rate of exports from UP to all markets |
| 61 & 62 | Apprels | 1,597 | 17% | -56% | -4.8% |
| 87 | Vehicles & Auto-components | 493 | 16% | -38% | 19.9% |
| 84 | Machinery & Equipment | 611 | 12% | -45% | 9% |
| 72 & 73 | Iron and steel articles | 736 | 12% | -30% | 50.6% |
| 48 | Paper and paperboard | 113 | 4% | -29% | 11.5% |
| 29 | Organic Chemicals | 484 | 4% | -58% | -1.8% |
| 23 | Residues and waste from the food industries | 84 | 3% | 5% | -0.9% |
| 33 | Essential oils and resinoids | 221 | 3% | -19% | -0.3% |
| 39 | Plastic and Articles | 223 | 3% | 37% | 3.7% |
| 85 | Electricals & Electronics | 2,774 | 3% | -42% | 94% |
Select sectors are identified as potential opportunities which may drive growth of exports from Uttar Pradesh to Mexico. The sectors are selected based on the import demand in Mexico, India’s exports to Mexico and UP’s exports to Mexico. The priority sectors shortlisted are classified into two categories, based on the relevant strategy for export promotion. The sectors with significant manufacturing and exports volume to Mexico are strategically selected for scaling up of exports. The sectors with appreciable manufacturing volume, but low level of exports from UP to Mexico are selected for market diversification into Mexico.
The table below summarizes the top 10 sectors shortlisted for UP’s exporters who intend to undertake exports in Mexico. Gems & Jewellery, Vehicles & auto-components, electricals & electronics, plastics & its articles, apparels, furniture and articles of iron & steel are shortlisted for scaling up in UK. Similarly, Machinery, mechanical appliances & equipment, pharmaceutics and Optical, photographic, cinematographic & medical instruments are shortlisted for market diversification into UK. A comprehensive detail for the select 10 sectors at a HS 6 level is described in annexure 3.
| Potential sectors for driving UP’s exports growth in Mexico | |||||||
|---|---|---|---|---|---|---|---|
| HS Code | Product Description | Value imported by Mexico (USD Mn) | Exports from India to Mexico (USD Mn) | UP’s exports to Mexico (USD Mn) | Potential intervention strategy | ||
| 84 | Machinery & Equipment | 15,917 | 271.2 | 12.2 | Scaling up | ||
| 87 | Vehicles & Auto-components | 13,645 | 454.5 | 1.1 | Diversification | ||
| 85 | Electrical & Electronics | 13,585 | 171.4 | 3.2 | Diversification | ||
| 72 & 73 | Iron and Steel articles | 7,642 | 286.3 | 10.3 | Scaling up | ||
| 39 | Plastics and articles | 3,225 | 87 | 2.1 | Diversification | ||
| 71 | Gems and Jewelry | 3,174 | 38 | 1.2 | Diversification | ||
| 10 | Cereals | 2,972 | 971.2 | 13.3 | Scaling up | ||
| 94 | Furnitures | 2,269 | 16.5 | 2.6 | Diversification | ||
| 61 & 62 | Apparels | 3,351 | 365.6 | 28.9 | Scaling up | ||
| 42 & 64 | Leather and Footwear | 1,261 | 31.3 | 11.8 | Scaling up | ||
| 57 | Carpets & floor coverings | 468.3 | 8.7 | 5.1 | Scaling up | ||
| 70 | Glass and glassware | 394.7 | 8.5 | 1.6 | Diversification | ||
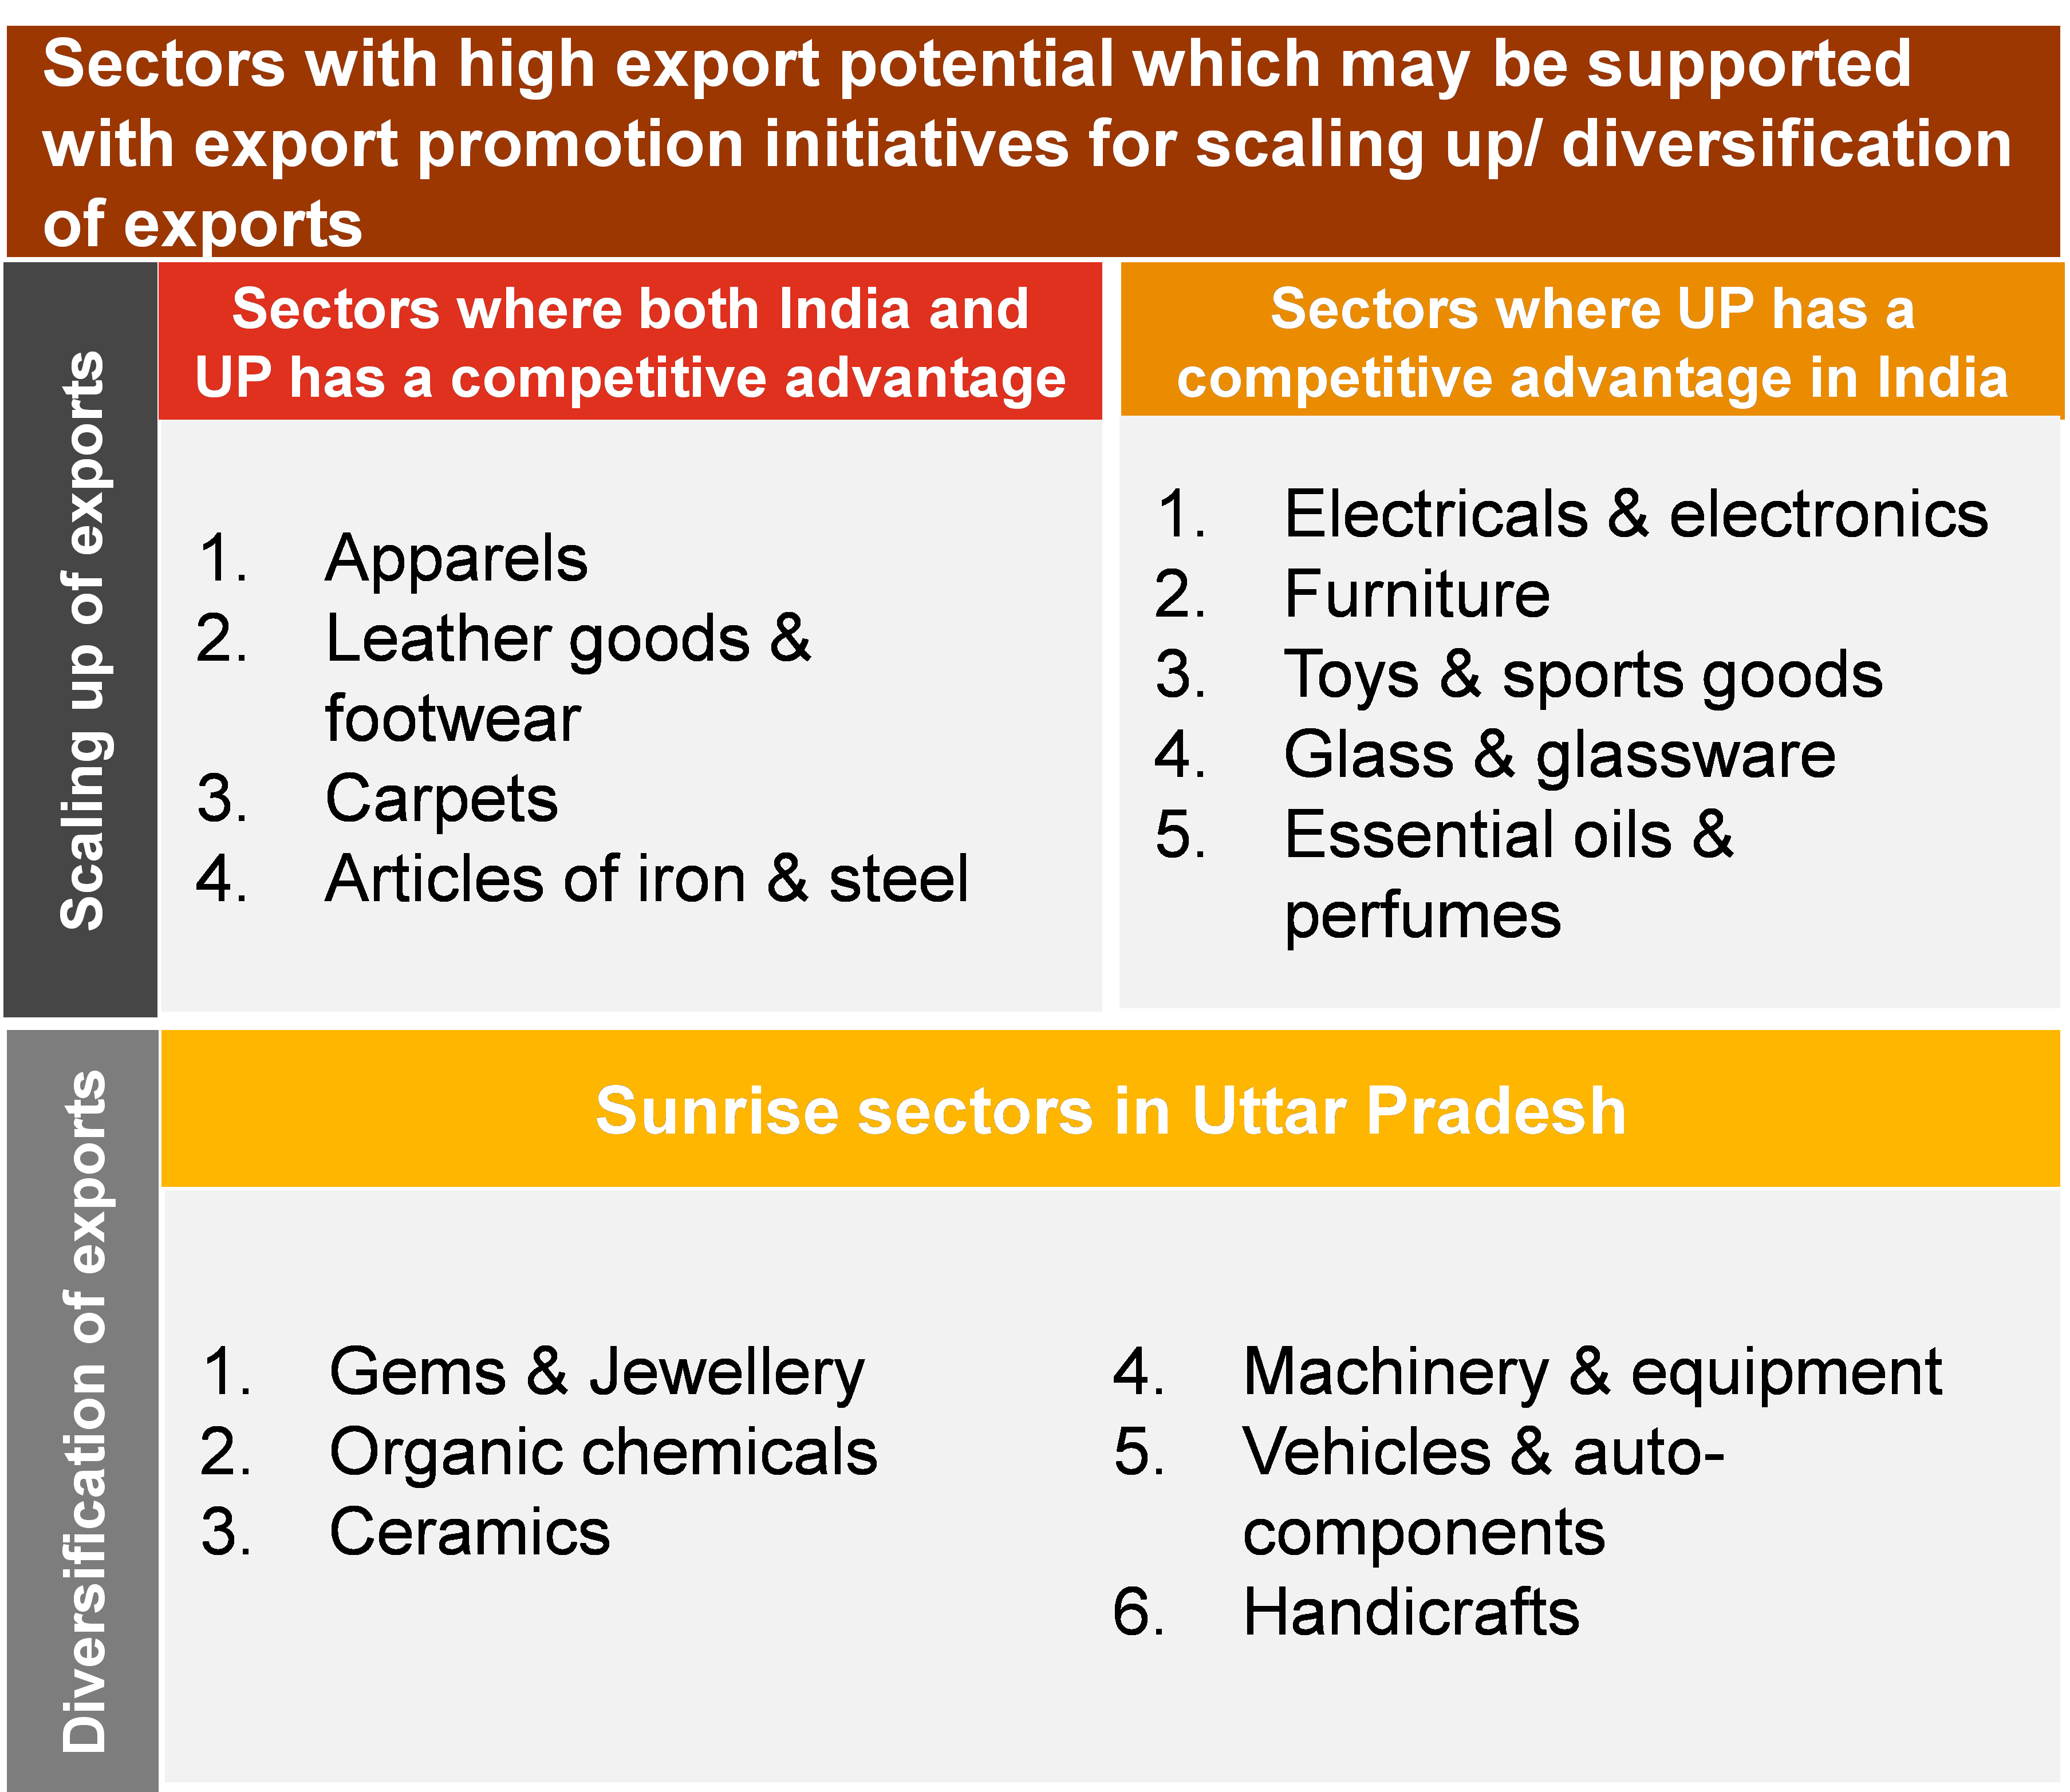
Uttar Pradesh’s export capabilities in select sectors resonates with the consumer demands in Mexico. At a global level, the priority sectors are classified on based on their RCA scores to identify the relevant export promotion strategies. The traditional sectors for which UP has a competitive advantage are selected for scaling up globally. Similarly, the sunrise sectors are selected for product development and market diversification to boost exports as shown in Figure 5. Also, the state government has shortlisted products with a high export potential for each district of the state under the ‘Districts as Export Hubs’ initiative.
At a country level, the export trends are analyzed to identify country level strategies for export promotion as described in table 3. Further, to support exporters of the state in scaling of exports, the government of Uttar Pradesh through Export Promotion Bureau – Uttar Pradesh and Uttar Pradesh Export Promotion Council has planned to undertake the following initiatives: 1. Identifying and connecting with Sectoral bodies (for priority sectors) based in Mexico 2. Identifying importers and their sourcing needs 3. List of key events where UP's exporters shall participate 4. Facilitate visit of Mexico’s Importers to UP in key trade events that may be organized by Government of Uttar Pradesh 5. Identification of online platforms where UP's exporters should register for exporting their products to meet sourcing requirements of the market
| Exporters | Imported value in 2018 | Imported value in 2019 | Imported value in 2020 | 3 year average | % share |
|---|---|---|---|---|---|
| Total | 387,065 | 420,369 | 464,277 | 455,236 | 100% |
| United States of America | 216,254 | 206,134 | 168,197 | 196,862 | 45% |
| China | 83,505 | 83,031 | 73,506 | 80,014 | 18% |
| Japan | 18,193 | 17,956 | 13,893 | 16,681 | 4% |
| Germany | 17,761 | 17,680 | 13,871 | 16,437 | 4% |
| Korea, Republic of | 16,727 | 17,644 | 14,706 | 16,359 | 4% |
| Malaysia | 9,391 | 11,584 | 10,822 | 10,599 | 2% |
| Canada | 10,772 | 9,825 | 8,318 | 9,638 | 2% |
| Taipei, Chinese | 8,269 | 9,309 | 8,761 | 8,780 | 2% |
| Brazil | 6,511 | 6,639 | 5,634 | 6,261 | 1% |
| Thailand | 6,361 | 6,074 | 5,303 | 5,913 | 1% |
| Italy | 6,611 | 6,097 | 4,838 | 5,849 | 1% |
| Viet Nam | 4,410 | 6,079 | 6,604 | 5,698 | 1% |
| India | 5,232 | 5,180 | 4,254 | 4,888 | 1% |
| Spain | 5,520 | 4,574 | 3,760 | 4,618 | 1% |
| France | 4,390 | 4,405 | 3,393 | 4,063 | 1% |
| Philippines | 2,807 | 3,132 | 2,767 | 2,902 | 1% |
| Netherlands | 2,452 | 2,154 | 2,032 | 2,213 | 1% |
| United Kingdom | 2,420 | 2,388 | 1,811 | 2,207 | 1% |
| Others | 36,691 | 35,351 | 30,508 | 34,183 | 8% |
| HS Code | Product Description | Imported value in 2018 | Imported value in 2019 | Imported value in 2020 | 3 year average | % share |
|---|---|---|---|---|---|---|
| 'TOTAL | 'All products | 387,065 | 420,369 | 464,277 | 455,236 | 100% |
| '85 | Electrical machinery and equipment and parts thereof; sound recorders and reproducers, television image and sound recorders and reproducers, and parts and accessories of such articles | 94,899 | 94,771 | 82,867 | 90,846 | 21% |
| '84 | Machinery, mechanical appliances, nuclear reactors, boilers; parts thereof | 77,461 | 76,962 | 65,845 | 73,423 | 17% |
| '87 | Vehicles other than railway or tramway rolling stock, and parts and accessories thereof | 43,056 | 42,685 | 32,068 | 39,270 | 9% |
| '27 | Mineral fuels, mineral oils and products of their distillation; bituminous substances; mineral waxes | 46,332 | 40,960 | 25,107 | 37,466 | 9% |
| '39 | Plastics and articles thereof | 25,295 | 24,585 | 21,865 | 23,915 | 6% |
| '99 | Commodities not elsewhere specified | 17,161 | 17,941 | 15,272 | 16,791 | 4% |
| '90 | Optical, photographic, cinematographic, measuring, checking, precision, medical or surgical instruments and apparatus; parts and accessories thereof | 15,255 | 16,233 | 15,739 | 15,742 | 4% |
| '72 | Iron and steel | 11,641 | 10,748 | 8,803 | 10,397 | 2% |
| '73 | Articles of iron or steel | 9,758 | 9,823 | 8,221 | 9,267 | 2% |
| '29 | Organic chemicals | 9,603 | 8,335 | 7,464 | 8,467 | 2% |
| '76 | Aluminium and articles thereof | 7,031 | 6,855 | 5,863 | 6,583 | 2% |
| '40 | Rubber and articles thereof | 7,020 | 6,850 | 5,613 | 6,494 | 1% |
| '48 | Paper and paperboard; articles of paper pulp, of paper or of paperboard | 5,982 | 5,898 | 5,053 | 5,644 | 1% |
| '38 | Miscellaneous chemical products | 5,295 | 5,670 | 5,764 | 5,577 | 1% |
| '10 | Cereals | 4,963 | 4,922 | 4,879 | 4,921 | 1% |
| '30 | Pharmaceutical products | 4,649 | 4,809 | 4,993 | 4,817 | 1% |
| '02 | Meat and edible meat offal | 3,878 | 4,220 | 3,544 | 3,881 | 1% |
| '94 | Furniture; bedding, mattresses, mattress supports, cushions and similar stuffed furnishings; lamps and lighting fittings, not elsewhere specified or included; illuminated signs, illuminated nameplates and the like; prefabricated buildings | 4,004 | 3,759 | 3,020 | 3,594 | 1% |
| '12 | Oil seeds and oleaginous fruits; miscellaneous grains, seeds and fruit; industrial or medicinal plants; straw and fodder | 3,475 | 3,487 | 3,598 | 3,520 | 1% |
| '33 | Essential oils and resinoids; perfumery, cosmetic or toilet preparations | 3,192 | 3,288 | 3,101 | 3,194 | 1% |
| '74 | Copper and articles thereof | 3,416 | 3,150 | 2,704 | 3,090 | 1% |
| '28 | Inorganic chemicals; organic or inorganic compounds of precious metals, of rare-earth metals, of radioactive elements or of isotopes | 2,666 | 2,739 | 2,730 | 2,712 | 1% |
| '83 | Miscellaneous articles of base metal | 2,846 | 2,733 | 2,350 | 2,643 | 1% |
| '32 | Tanning or dyeing extracts; tannins and their derivatives; dyes, pigments and other colouring matter; paints and varnishes; putty and other mastics; inks | 2,481 | 2,434 | 2,217 | 2,377 | 1% |
| '82 | Tools, implements, cutlery, spoons and forks, of base metal; parts thereof of base metal | 2,713 | 2,382 | 1,977 | 2,357 | 1% |
| '95 | Toys, games and sports requisites; parts and accessories thereof | 2,361 | 2,421 | 1,948 | 2,243 | 1% |
| Others | 47,841 | 46,575 | 40,374 | 44,930 | 10% |
| HS Code (6 digit) | Product Description | Share in Mexico’s import at the HS 2 level | Average share in global imports at HS2 level | Global exports by India | India’s share in global exports | Global exports by Uttar Pradesh |
|---|---|---|---|---|---|---|
| HS 84 – Machinery, mechanical appliances and equipment | ||||||
| '847330 | Parts and accessories of automatic data-processing machines or for other machines | 12% | 6% | 103 | 0.1% | 7.8 |
| '847170 | Storage units for automatic data-processing machines | 8% | 4% | 29 | 0.0% | 0.1 |
| '840820 | Compression-ignition internal combustion piston engine "diesel or semi-diesel engine", for the propulsion of vehicles | 7% | 1% | 268 | 0.9% | 1.8 |
| '840991 | Parts suitable for use solely or principally with spark-ignition internal combustion piston engine, n.e.s. | 4% | 1% | 298 | 1.0% | 23 |
| '840734 | Spark-ignition reciprocating piston engine, of a kind used for vehicles, of a cylinder capacity > 1.000 cm³ | 4% | 1% | 133 | 0.4% | 0.01 |
| '847130 | Data-processing machines, automatic, portable, weighing <= 10 kg, consisting of at least a central processing unit, a keyboard and a display (excluding peripheral units) | 3% | 7% | 49 | 0.03% | 0.8 |
| '847989 | Machines and mechanical appliances, n.e.s. | 2% | 2% | 367 | 0.8% | 8.1 |
| '842139 | Machinery and apparatus for filtering or purifying gases (excluding isotope separators and intake air filters for internal combustion engines) | 2% | 1% | 129 | 0.5% | 3.3 |
| '848180 | Appliances for pipes, boiler shells, tanks, vats or the like (excluding pressure-reducing valves, valves for the control of pneumatic power transmission, check "non-return" valves and safety or relief valves) | 2% | 2% | 806 | 1.5% | 13.2 |
| '848071 | Injection or compression-type moulds for rubber or plastics | 2% | 1% | 76 | 0.6% | 4.4 |
| Total of 10 commodity | 45% | 2,258 | 62.51 | |||
| Rest of the commodities under HS code 84 | 55% | 17,643 | 548.49 | |||
| HS 87 - Vehicles & Auto-components | ||||||
| '870840 | Gear boxes and parts thereof, for tractors, motor vehicles for the transport of ten or more persons, motor cars and other motor vehicles principally designed for the transport of persons, motor vehicles for the transport of goods and special purpose motor vehicles, n.e.s | 14% | 5% | 388 | 1% | 6 |
| '870829 | Parts and accessories of bodies for tractors, motor vehicles for the transport of ten or more persons, motor cars and other motor vehicles principally designed for the transport of persons, motor vehicles for the transport of goods and special purpose motor vehicles | 13% | 5% | 151 | 0.2% | 0.3 |
| '870323 | Motor cars and other motor vehicles principally designed for the transport of persons, incl. station wagons and racing cars, with spark-ignition internal combustion reciprocating piston engine of a cylinder capacity > 1.500 cm³ but <= 3.000 cm³ | 12% | 18% | 1768 | 1% | 0.2 |
| '870899 | Parts and accessories, for tractors, motor vehicles for the transport of ten or more persons, motor cars and other motor vehicles principally designed for the transport of persons, motor vehicles for the transport of goods and special purpose motor vehicles, n.e.s. | 9% | 6% | 2510 | 3% | 115 |
| '870322 | Motor cars and other motor vehicles principally designed for the transport of persons, incl. station wagons and racing cars, with spark-ignition internal combustion reciprocating piston engine of a cylinder capacity > 1.000 cm³ but <= 1.500 cm³ | 7% | 8% | 2795 | 3% | 8 |
| '870850 | Drive-axles with differential, whether or not provided with other transmission components, ... | 7% | 2% | 370 | 1% | 9 |
| '870830 | Brakes and servo-brakes and their parts, for tractors, motor vehicles for the transport of ten or more persons, motor cars and other motor vehicles principally designed for the transport of persons, motor vehicles for the transport of goods and special purpose motor vehicles, n.e.s. | 5% | 2% | 465 | 1% | 11 |
| '870840 | Gear boxes and parts thereof, for tractors, motor vehicles for the transport of ten or more persons, motor cars and other motor vehicles principally designed for the transport of persons, motor vehicles for the transport of goods and special purpose motor vehicles, n.e.s | 14% | 5% | 388 | 1% | 6 |
| '870829 | Parts and accessories of bodies for tractors, motor vehicles for the transport of ten or more persons, motor cars and other motor vehicles principally designed for the transport of persons, motor vehicles for the transport of goods and special purpose motor vehicles | 13% | 5% | 151 | 0.2% | 0.3 |
| '870323 | Motor cars and other motor vehicles principally designed for the transport of persons, incl. station wagons and racing cars, with spark-ignition internal combustion reciprocating piston engine of a cylinder capacity > 1.500 cm³ but <= 3.000 cm³ | 12% | 18% | 1768 | 1% | 0.2 |
| Total of top 3 commodities | 66% | 8447 | 150 | |||
| Rest of the commodities under HS code 87 | 34% | 7,782 | 343 | |||
| HS 85 - Electrical & Electronics | ||||||
| '854231 | Electronic integrated circuits as processors and controllers, whether or not combined with memories, converters, logic circuits, amplifiers, clock and timing circuits, or other circuits | 14% | 12% | 84 | 0.03% | 27 |
| '851762 | Machines for the reception, conversion and transmission or regeneration of voice, images or other data, incl. switching and routing apparatus (excluding telephone sets, telephones for cellular networks or for other wireless networks) | 7% | 6% | 568 | 0.4% | 4 |
| '854239 | Electronic integrated circuits (excluding such as processors, controllers, memories and amplifiers) | 4% | 9% | 144 | 0.1% | 75 |
| '851712 | "Telephones for cellular networks ""mobile telephones"" or for other wireless networks" | 5% | 10% | 2496 | 0.9% | 4 |
| '852990 | Parts suitable for use solely or principally with transmission and reception apparatus for radio-broadcasting or television, television cameras,digital cameras, video camera recorders, radar apparatus, radio navigational aid apparatus or radio remote control apparatus, monitors and projectors, n.e.s. | 4% | 2% | 128 | 0.2% | 24 |
| '853890 | Parts suitable for use solely or principally with the apparatus | 4% | 1% | 443 | 1.4% | 17 |
| '853690 | Electrical apparatus for switching electrical circuits, or for making connections to or in electrical circuits, for a voltage <= 1.000 V | 4% | 1% | 276 | 0.7% | 6 |
| '852351 | Solid-state, non-volatile data storage devices for recording data from an external source [flash memory cards or flash electronic storage cards | 2% | 1% | 33 | 0.1% | 1 |
| '850440 | Static converters | 3% | 2% | 995 | 1.6% | 11 |
| '853400 | Printed circuits | 3% | 2% | 125 | 0.3% | 3 |
| Total of top 10 commodities | 49% | 5293 | 1584 | |||
| Rest of the commodities under HS code 85 | 51% | 8,132 | 1,190 | |||
| HS 72 & 73 – Iron and Steel Articles | ||||||
| '732690 | Articles of iron or steel, n.e.s. (excluding cast articles or articles of iron or steel wire) | 13% | 7% | 731 | 2% | 282 |
| '731815 | Threaded screws and bolts, of iron or steel, whether or not with their nuts and washers (excluding coach screws and other wood screws, screw hooks and screw rings, self-tapping screws, lag screws, stoppers, plugs and the like, threaded) | 8% | 3% | 280 | 1% | 2 |
| '721049 | Flat-rolled products of iron or non-alloy steel, of a width of >= 600 mm, hot-rolled or cold-rolled "cold-reduced", not corrugated, plated or coated with zinc (excluding electrolytically plated or coated with zinc) | 4% | 3% | 350 | 2% | 0.1 |
| '731816 | Nuts of iron or steel | 3% | 1% | 65 | 1% | 1 |
| '722592 | Flat-rolled products of alloy steel other than stainless, of a width of >= 600 mm, hot-rolled or cold-rolled ""cold-reduced"" and plated or coated with zinc (excluding electrolytically plated or coated and products of silicon-electrical steel) | 3% | 1% | 7 | 0% | 0 |
| '722592 | Flat-rolled products of alloy steel other than stainless, of a width of >= 600 mm, hot-rolled or cold-rolled ""cold-reduced"" and plated or coated with zinc (excluding electrolytically plated or coated and products of silicon-electrical steel) | 3% | 1% | 7 | 0% | 0 |
| '732020 | Helical springs, of iron or steel (excluding flat spiral springs, clock and watch springs, springs for sticks and handles of umbrellas or parasols, and shock absorbers of Section 17) | 2% | 0.5% | 7 | 0% | 0.1 |
| '720449 | Waste and scrap of iron or steel (excluding slag, scale and other waste of the production of ... | 2% | 4% | 2 | 0% | 0.01 |
| '722830 | Bars and rods of alloy steel other than stainless, not further worked than hot-rolled, hot-drawn or extruded (excluding products of high-speed steel or silico-manganese steel, semi-finished products, flat-rolled products and hot-rolled bars and rods in irregularly wound coils) | 2% | 1% | 37 | 1% | 0.1 |
| '720917 | Flat-rolled products of iron or non-alloy steel, of a width of >= 600 mm, in coils, simply cold-rolled "cold-reduced", not clad, plated or coated, of a thickness of >= 0,5 mm but <= 1 mm | 2% | 1% | 159 | 3% | 0.01 |
| Total of top 10 commodities | 41% | 1650 | 285.32 | |||
| Rest of the commodities under HS code 72 & 73 | 59% | 15,344 | 345.68 | |||
| HS 39 – Plastic and articles thereof | ||||||
| '392690 | Articles of plastics and articles of other materials | 18% | 10% | 549 | 1% | 21 |
| '392310 | Boxes, cases, crates and similar articles for the conveyance or packaging of goods, of plastics | 5% | 2% | 47 | 0.4% | 1 |
| '390210 | Polypropylene, in primary forms | 4% | 4% | 697 | 3% | 0.1 |
| '390120 | Polyethylene with a specific gravity of >= 0,94, in primary forms | 3% | 5% | 403 | 1% | 32 |
| '390740 | Polycarbonates, in primary forms | 3% | 2% | 7 | 0.1% | 0.3 |
| '391990 | Self-adhesive plates, sheets, film, foil, tape, strip and other flat shapes, of plastics, whether or not in rolls > 20 cm wide | 3% | 2% | 75 | 0.5% | 2 |
| '392190 | Plates, sheets, film, foil and strip, of plastics, reinforced, laminated, supported or similarly combined with other materials, unworked or merely surface-worked or merely cut into squares or rectangles | 3% | 2% | 310 | 2% | 42 |
| '392010 | Plates, sheets, film, foil and strip, of non-cellular polymers of ethylene, not reinforced, laminated, supported or similarly combined with other materials, without backing, unworked or merely surface-worked or merely cut into squares or rectangles | 2% | 3% | 82 | 1% | 1 |
| '392390 | Articles for the conveyance or packaging of goods, of plastics (excluding boxes, cases, crates and similar articles; sacks and bags, incl. cones; carboys, bottles, flasks and similar articles; spools, spindles, bobbins and similar supports; stoppers, lids, caps and other closures) | 3% | 1% | 143 | 2% | 10 |
| '390230 | Propylene copolymers, in primary forms | 3% | 2% | 35 | 0.2% | 0 |
| Total of top commodity | 46% | 2347 | 109 | |||
| Rest of the commodities under HS code 39 | 54% | 4,930 | 114 | |||
| HS 57 -Carpets | ||||||
| '570320 | Carpets and other floor coverings, of nylon or other polyamides, tufted "needle punched", whether or not made up | 45% | 18% | 9.3 | 0.30% | 0.5 |
| '570330 | Carpets and other floor coverings, of man-made textile materials, tufted "needle punched", whether or not made up (excluding those of nylon or other polyamides) | 24% | 21% | 142.6 | 4% | 11.4 |
| Total of top 2 commodities | 69% | 151.9 | 11.9 | |||
| Rest of the commodities under HS code 57 | 31% | 1,568.1 | 535.1 | |||
| HS 29 – Organic Chemicals | ||||||
| '290243 | P-Xylene | 9% | 4% | 2323 | 13% | 0 |
| '290250 | Styrene | 9% | 2% | 8 | 0.1% | 0 |
| '290919 | Acyclic ethers and their halogenated, sulphonated, nitrated or nitrosated derivatives (excluding diethyl ether) | 5% | 1% | 102 | 2% | 0.03 |
| '290122 | "Propene ""propylene""" | 4% | 2% | 18 | 0% | 0 |
| '290531 | "Ethylene glycol ""ethanediol""" | 3% | 3% | 187 | 3% | 0.004 |
| '293499 | Nucleic acids and their salts, whether or not chemically defined; heterocyclic compounds (excluding with oxygen only or with nitrogen hetero-atom[s] only, compounds containing in the structure an unfused thiazole ring or a benzothiazole or phenothiazine ring-system, not further fused and aminorex "INN", brotizolam "INN", clotiazepam "INN", cloxazolam "INN", dextromoramide "INN", haloxazolam "INN", ketazolam "INN", mesocarb "INN", oxazolam "INN", pemoline "INN", phendimetrazine "INN", phenmetrazine "INN", sufentanil "INN", and salts thereof, and inorganic or organic compounds of mercury whether or not chemically defined,) | 2% | 4% | 516 | 3% | 4 |
| '291521 | Acetic acid | 2% | 0% | 10 | 1% | 0.2 |
| '293339 | Heterocyclic compounds with nitrogen hetero-atom[s] only, containing an unfused pyridine ring, whether or not hydrogenated, in the structure (excluding pyridine, piperidine, alfentanil "INN", anileridine "INN", bezitramide "INN", bromazepam "INN", difenoxin "INN", diphenoxylate "INN", dipipanone "INN", fentanyl "INN", ketobemidone "INN", methylphenidate "INN", pentazocine "INN", pethidine "INN", pethidine "INN" intermediate A, phencyclidine "INN" "PCP", phenoperidine "INN", pipradol "INN", piritramide "INN", propiram "INN", trimeperidine "INN", and salts thereof, and inorganic or organic compounds of mercury) | 2% | 3% | 664 | 5% | 37 |
| '290339 | Fluorinated, brominated or iodinated derivatives of acyclic hydrocarbons (excluding ethylene dibromide [ISO] [1,2-dibromoethane]) | 2% | 1% | 53 | 2% | 0.1 |
| '293090 | Organo-sulphur compounds (excl. thiocarbamates and dithiocarbamates, thiuram mono-, di- or tetrasulphides, methionine, 2-(N,N-Diethylamino)ethanethiol, Bis(2-hydroxyethyl)sulfide (thiodiglycol (INN)), aldicarb [ISO], captafol [ISO], methamidophos [ISO] and 2-(N,N-Dimethylamino) ethanethiol) | 2% | 1% | 142 | 3% | 0.02 |
| Total of top 9 commodities | 40% | 4023 | 41.4 | |||
| Rest of the commodities under HS code 94 | 60% | 13,807 | 442.6 | |||
| HS 94 – Furniture | ||||||
| '940190 | Parts of seats, n.e.s. | 37% | 13% | 65 | 0.2% | 7 |
| '940320 | Metal furniture (excluding for offices, seats and medical, surgical, dental or veterinary furniture) | 5% | 7% | 134 | 0.8% | 14 |
| '940120 | Seats for motor vehicles | 6% | 1% | 35 | 1.2% | 0.1 |
| '940540 | Electric lamps and lighting fittings, n.e.s. | 6% | 7% | 34 | 0.1% | 3 |
| '940510 | Chandeliers and other electric ceiling or wall lighting fittings (excluding for lighting public open spaces or thoroughfares) | 5% | 7% | 54 | 0.3% | 18 |
| '940600 | Prefabricated buildings, whether or not complete or already assembled | 4% | 0% | 0 | 0.0% | 0 |
| '940390 | Parts of furniture, n.e.s. (excluding of seats and medical, surgical, dental or veterinary furniture) | 4% | 6% | 30 | 0.2% | 6 |
| Total of top 7 commodities | 68% | 351 | 48.1 | |||
| Rest of the commodities under HS code 94 | 32% | 1,421 | 298.9 | |||
| HS 33 – Essential oils | ||||||
| '330210 | Mixtures of odoriferous substances and mixtures, incl. alcoholic solutions, with a basis of one or more of these substances, of a kind used in the food and drink industries; other preparations based on odoriferous substances, of a kind used for the manufacture of beverages | 47% | 12% | 77 | 0.5% | 13 |
| '330290 | Mixtures of odoriferous substances and mixtures, incl. alcoholic solutions, based on one or more of these substances, of a kind used as raw materials in industry (excluding food or drink industries) | 11% | 13% | 271 | 3% | 50 |
| '330499 | Beauty or make-up preparations and preparations for the care of the skin (other than medicaments), incl. sunscreen or suntan preparations (excluding medicaments, lip and eye make-up preparations, manicure or pedicure preparations and make-up or skin care powders, incl. baby powders) | 12% | 33% | 134 | 0.3% | 32 |
| Total of top 3 commodities | 70% | 482 | 96 | |||
| Rest of the commodities under HS code 33 | 30% | 1566 | 110.6 | |||
| HS 48 – Paper and Paperboard | ||||||
| '481910 | Cartons, boxes and cases, of corrugated paper or paperboard | 13% | 5% | 37.5 | 0.4% | 1 |
| '480411 | Unbleached kraftliner, uncoated, in rolls of a width > 36 cm | 9% | 3% | 14.2 | 0.3% | 1 |
| '480810 | Corrugated paper and paperboard, whether kg. 10% - or not perforated | 6% | 1% | 0.8 | 0.1% | 0 |
| '481920 | Folding cartons, boxes and cases, of non-corrugated paper or paperboard | 5% | 5% | 69.3 | 0.8% | 1 |
| '482390 | Paper, paperboard, cellulose wadding and webs of cellulose fibres, in strips or rolls of a width <= 36 cm, in rectangular or square sheets, of which no side > 36 cm in the unfolded state, or cut to shape other than rectangular or square, and articles of paper pulp, paper, cellulose wadding or webs of cellulose fibres, n.e.s. | 5% | 2% | 308.8 | 7.1% | 24 |
| '481032 | Kraft paper and paperboard, bleached uniformly throughout the mass and containing > 95% chemically processed wood fibres by weight in relation to the total fibre content, coated on one or both sides with kaolin or other inorganic substances, in rolls or in square or rectangular sheets, of any size, weighing > 150 g/m² (excluding that for writing, printing or other graphic purposes) | 4% | 1% | 0.1 | 0.0% | 0 |
| '480511 | Semi-chemical fluting paper, uncoated, in rolls of a width > 36 cm | 3% | 1% | 6.5 | 0.5% | 0.2 |
| '482110 | Paper or paperboard labels of all kinds, printed | 3% | 2% | 20.5 | 0.5% | 2 |
| '481092 | Multi-ply paper and paperboard, coated on one or both sides with kaolin or other inorganic substances, in rolls or in square or rectangular sheets, of any size (excluding that for writing, printing or other graphic purposes, kraft paper and paperboard) | 3% | 5% | 88.6 | 1.0% | .2 |
| '481190 | Paper, paperboard, cellulose wadding and webs of soft cellulose, coated, impregnated, covered, surface-coloured, surface-decorated or printed, in rolls or in square or rectangular sheets, of any size | 3% | 3% | 18.3 | 0.4% | 6 |
| Total of top 10 commodities | 55% | 565 | 35.4 | |||
| Rest of the commodities under HS code 48 | 45% | 1,315 | 77.6 | |||
