Nigeria is a USD 426 Billion economy. The country is home to 200 million residents , with a high consumption potential. The GDP of the country has shown a significant growth from USD 376 Billion in 2017 to USD 448 Billion in 2019. On an average, the final consumption of the country accounts for around 80% of the GDP whereas the household consumption accounts for around 74% of the GDP, indicating a potential consumer goods market.
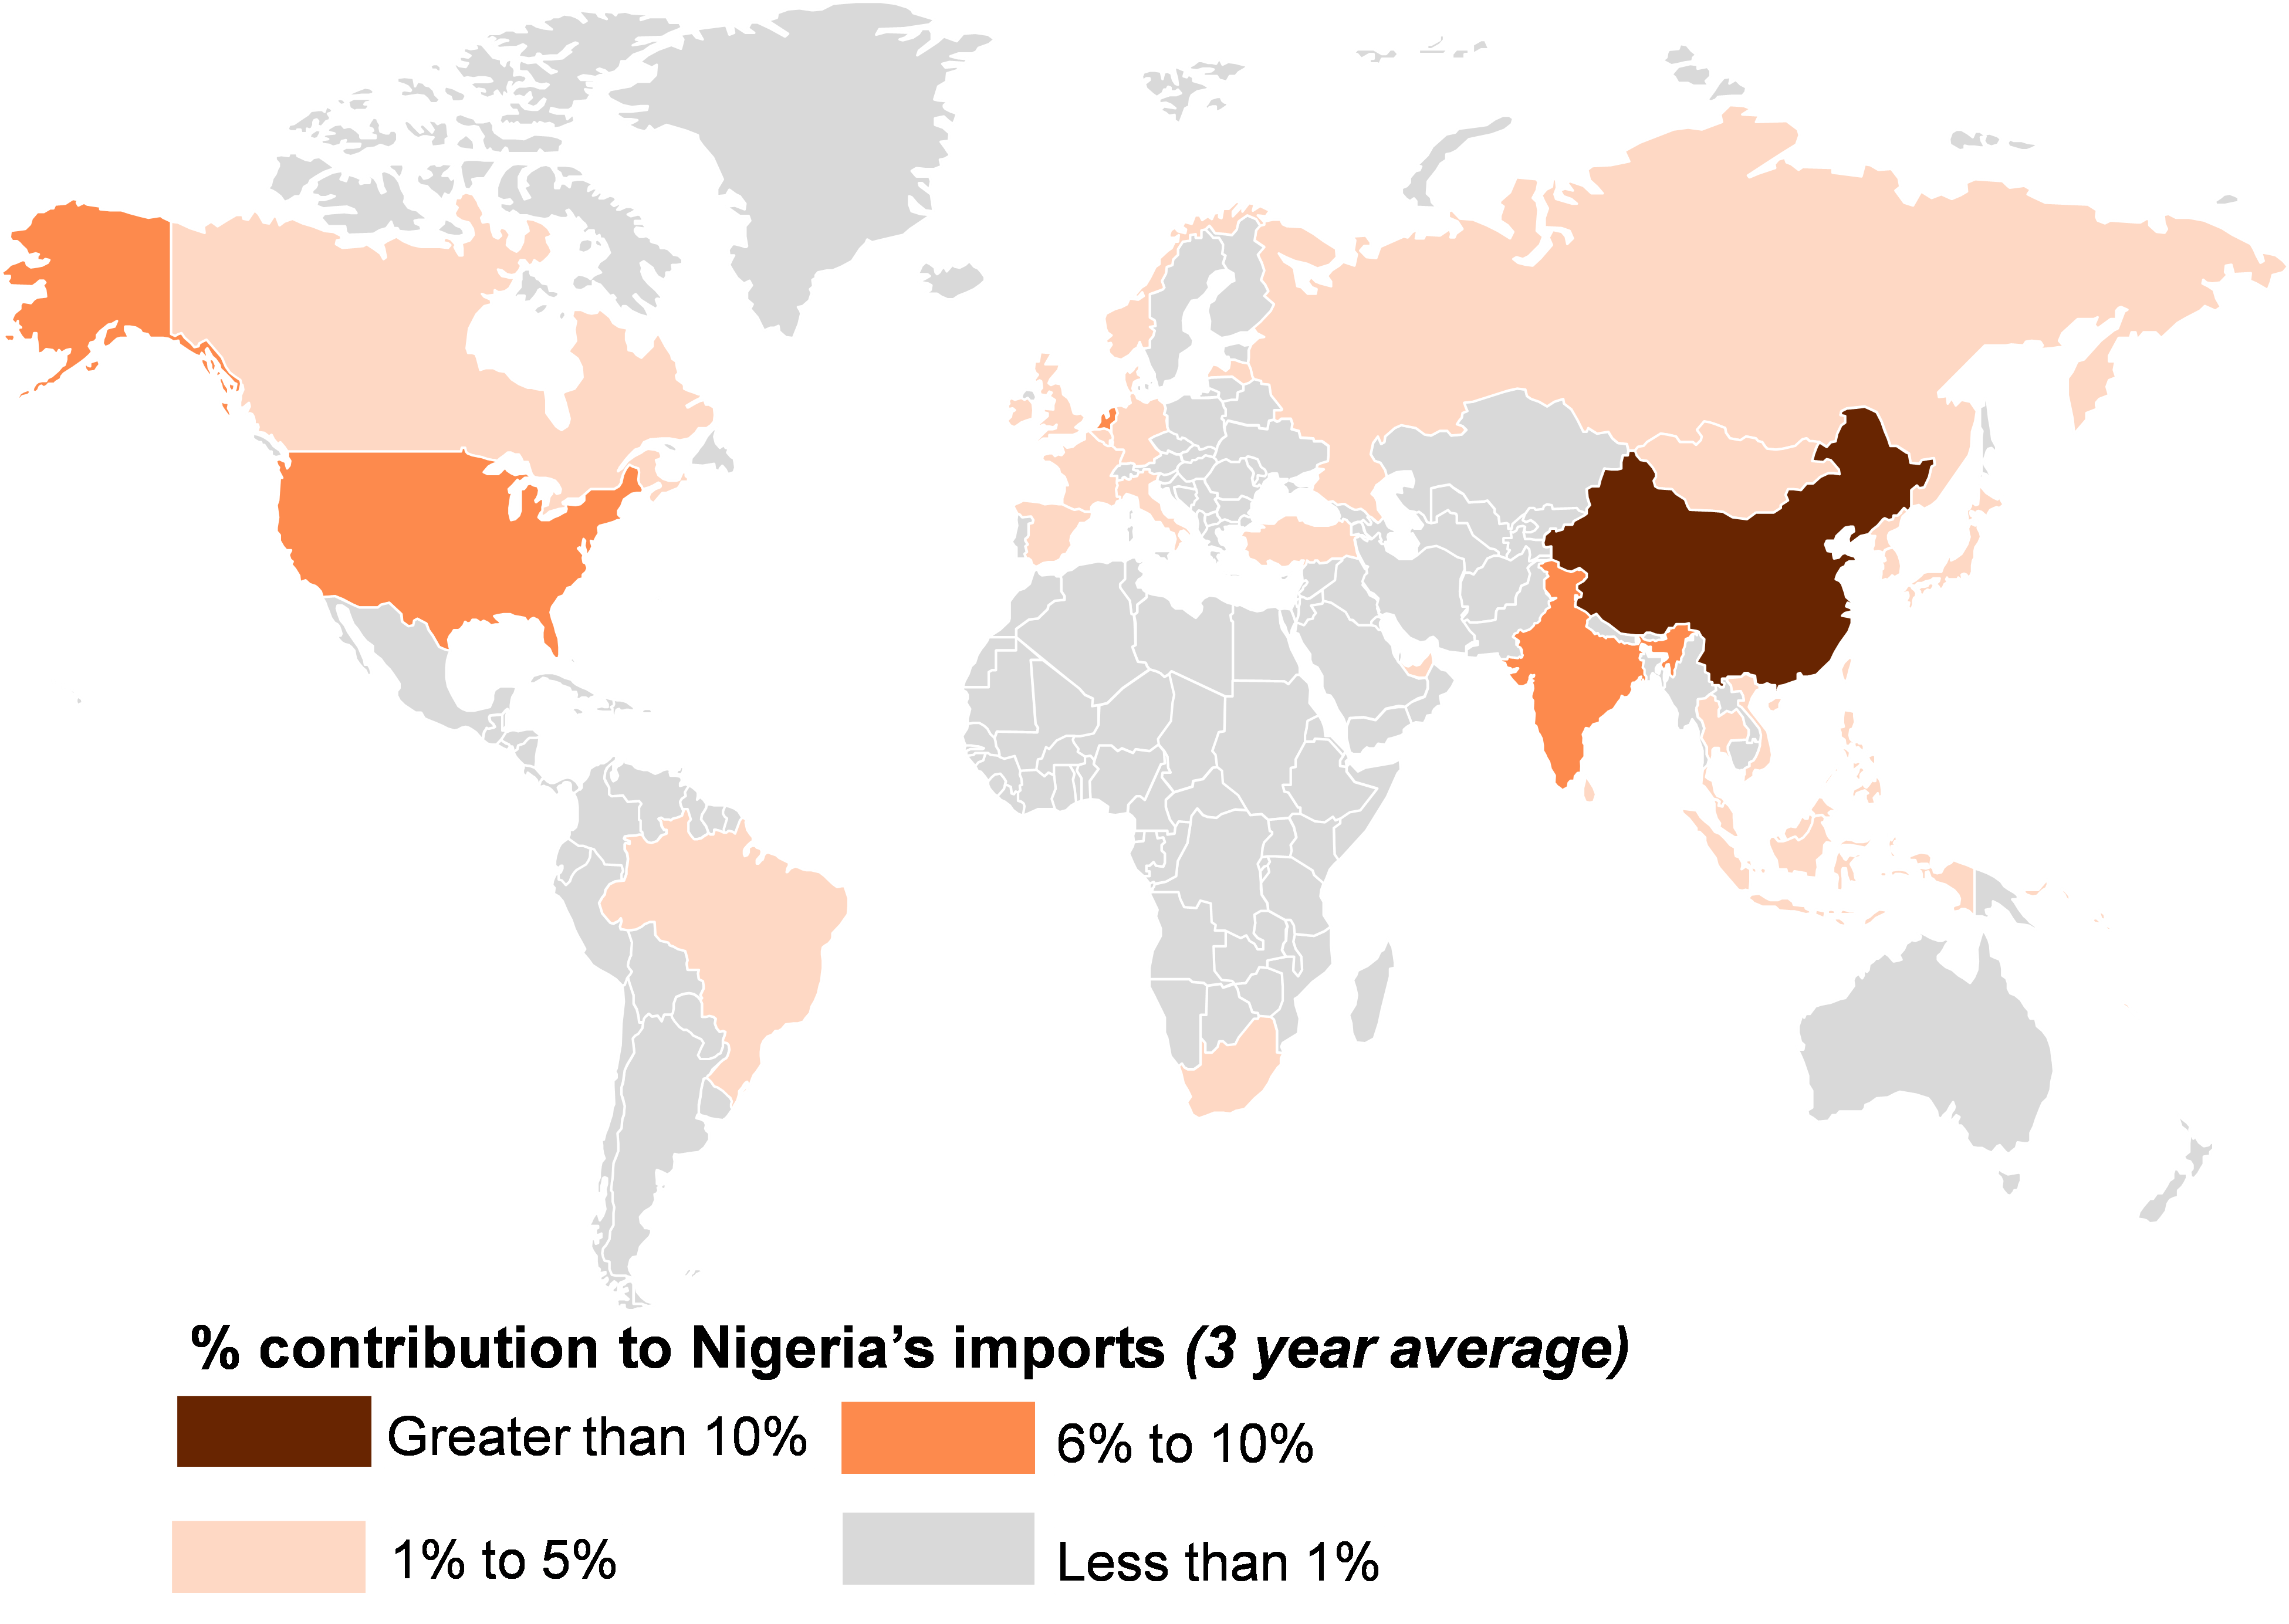
Nigeria is a USD 45 Bn import market, which is largely serviced by exporters from China, US, India and Southeastern countries like South Korea and European countries like Netherlands and Belgium. Nigeria’s imports have grown from USD 36 Billion in 2016 to USD 47 Billion in 2019. And further to USD 53 Billion in 2020.
China accounts for the largest share in the Nigerian import market covering as much as 25% of the total imports Nigeria makes. And is followed by US and India where both the countries hold up to 9% share each. The top 10 countries contributing other than China, US and India that constitutes approximately 65% of imports to Nigeria are Netherlands, Belgium, South Korea, Germany, UK, France and Russia. A detailed list of key countries exporting to Nigeria is attached in annexure 01.
The Nigerian government has signed AFCFTA (African Continental Free Trade Area) Agreement. AFCFTA is an intra-African trade agreement intended to boost, improve, and accelerate Africa’s trade in the global markets. It focuses on improving Africa’s policy spaces at par with global negotiation policies. 36 countries has signed the AFCFTA so far as of 5 February 2021.
Nigeria in general imports USD 45.6 Billion worth of products on an average basis. Of that the leading sectors that contribute to 73% of Nigeria’s imports are Machinery & equipment, Vehicles & auto-components, Electricals & electronics, mineral fuels, pharmaceuticals, Cereal, Ship and Boats, Fish and Invertebrates, Plastics & its articles, Organic chemicals, and Optical, photographic & Cinematographic devices.

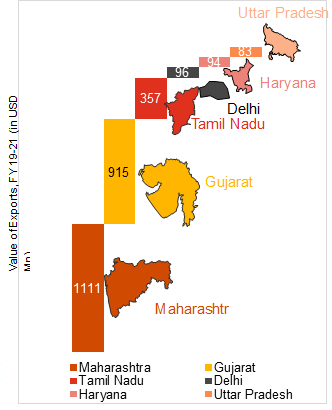
India exports an average of USD 3.31 Billion worth of goods to Nigeria per year. India’s share in the country’s imports have increased from 5.1% in 2016 to 12% in 2019, but due to COVID scenario in 2020, it contracted to 8%. India exported commodities worth USD 4.5 last year. Maharashtra, Gujarat, Tamil Nadu, Delhi, Haryana, and Uttar Pradesh are the top 6 states of India in terms of exports to Nigeria, contributing approximately 69% of India’s exports to Nigeria.
India’s exports to Nigeria are characterized by exports of the following top 10 sectors: Mineral fuels & oils, Plastics & articles, iron and steel, paper and paperboard, pharmaceuticals, machinery, apparels & textiles, electricals & electronics, footwear, vehicles & auto-components, organic chemicals, aircrafts etc. as shown in table below. The table also discusses the percentage share of the sector in India’s exports to Nigeria and the contribution of India’s exports in Nigeria’s total imports of that sector at a HS 2 level. The sectors highlighted in yellow are the key sectors identified for driving exports growth from Uttar Pradesh.
| Table 1: Top sectors contributing to 67% of India’s exports to Nigeria | |||||||
|---|---|---|---|---|---|---|---|
| Sector | India’s exports to Nigeria, (USD Mn) | % share of sector in India’s exports globally | % share of India’s exports to Nigeria’s imports | ||||
| HS 87, Vehicles & Auto-components | 496 | 0.049 | 0.15 | ||||
| HS 27, Mineral fuels & products | 468 | 0.132 | 0.141 | ||||
| HS 84, Machinery & Equipment | 443 | 0.064 | 0.134 | ||||
| HS 30, Pharmaceuticals | 395 | 0.053 | 0.119 | ||||
| HS 85, Electricals & electronics | 252 | 0.047 | 0.076 | ||||
| HS 39, Plastics & articles thereof | 163 | 0.023 | 0.049 | ||||
| HS 61 & 62, Apparels | 211 | 0.044 | 0.064 | ||||
| HS 73, Articles of Iron and Steel | 87 | 0.022 | 0.026 | ||||
| HS 29, Organic Chemicals | 86 | 0.057 | 0.026 | ||||
| HS 48 Paper and paperboard | 64 | 0.007 | 0.02 | ||||
| Total exports (3 year average) | USD 3.3 Bn | ||||||
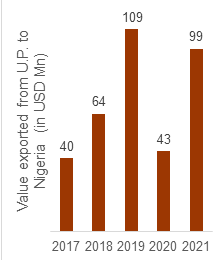
The exports from Uttar Pradesh to Nigeria grew at a CAGR of 8.4% in the last 5 years. Uttar Pradesh exported a total of USD 99 Million value of commodities to Nigeria in 2021. Post the COVID impact in 2020, the exports from UP to Nigeria accelerated by approximately 130% in 2021. With that CAGR and such a great rebound after the pandemic, that indicates there is a high potential for growth in Nigerian markets.
10 select sectors contributed to approximately 89% of UP’s exports to Nigeria during the last 3 years. Export growth rate of 5 particular sectors highlighted in yellow has higher growth rate in Nigeria than the growth rate of UP’s exports in all other markets, thus acting as the drivers of Uttar Pradesh’s expand and growth in Nigeria. The table below summarizes the top 10 products exported from UP to Nigeria:
| Top commodities exported from UP to Nigeria | |||||||||
|---|---|---|---|---|---|---|---|---|---|
| HS code | Product description | Value of Exports (in USD Mn) | % share in UP’s exports to Nigeria | Growth rate of exports from UP to Nigeria | Growth rate of exports from UP to all markets | ||||
| 84 | Machinery & Equipment | 611 | 0.384 | -0.246 | 0.09 | ||||
| 85 | Electricals & electronics | 2774 | 0.198 | -0.186 | 0.094 | ||||
| 73 | Articles of Iron and Steel | 599 | 0.073 | -0.161 | 0.16 | ||||
| 29 | Organic Chemicals | 484 | 0.062 | 0.343 | -0.018 | ||||
| 39 | Plastics & articles thereof | 223 | 0.043 | 0.421 | 0.037 | ||||
| 90 | Optical, photographic, cinematographic devices | 132 | 0.039 | 0.358 | 0.118 | ||||
| 61 & 62 | Apparels | 5784 | 0.037 | 1.206 | -0.048 | ||||
| 48 | Paper and paperboard | 113 | 0.024 | 2.772 | 0.115 | ||||
| 38 | Miscellaneous chemical products | 79 | 0.013 | -0.203 | 0.005 | ||||
| 33 | Essential oils and resinoids; perfumery, cosmetic or toilet preparations | 221 | 0.012 | -0.021 | 0.014 | ||||
Select sectors are identified as potential opportunities which may drive growth of exports from Uttar Pradesh to Nigeria. The sectors are selected based on the import demand in Nigeria, India’s exports to Nigeria and UP’s exports to Nigeria.
The priority sectors shortlisted are classified into two categories, based on the relevant strategy for export promotion. The sectors with significant manufacturing and exports volume to Nigeria are strategically selected for scaling up of exports. The sectors with appreciable manufacturing volume, but low level of exports from UP to Nigeria are selected for market diversification into Nigeria. The table below summarizes the top 10 sectors shortlisted for UP’s exporters who intend to undertake exports in Nigeria. A comprehensive detail for the select 10 sectors at a HS 6 level is described in annexure 3.
| Potential sectors for driving UP’s exports growth in Nigeria) | |||||
|---|---|---|---|---|---|
| HS Code | Product Description | Value imported by Nigeria (USD Mn) | Exports from India to Nigeria (USD Mn) | UP’s exports to Nigeria (USD Mn) | Potential intervention strategy |
| 84 | Machinery & Equipment | 8005 | 443 | 32 | Scaling up |
| 87 | Vehicles & Auto-components | 4401 | 496 | 0.74 | Diversification |
| 85 | Electricals & electronics | 3158 | 252 | 17 | Scaling up |
| 39 | Plastics and articles | 1772 | 163 | 3.6 | Diversification |
| 90 | Optical, photographic, cinematographic devices | 1688 | 43 | 3.2 | Diversification |
| 30 | Pharmaceutical products | 1602 | 395 | 1 | Diversification |
| 10 & 17 | Cereals and Confectionary | 2213 | 21 | 0.05 | Diversification |
| 72 & 73 | Iron and Steel Articles | 1688 | 117 | 6.4 | Scaling up |
| 29 | Organic chemicals | 749 | 86 | 5.1 | Scaling up |
| 70 | Glass and Glassware | 537 | 8 | 0.47 | Diversification |
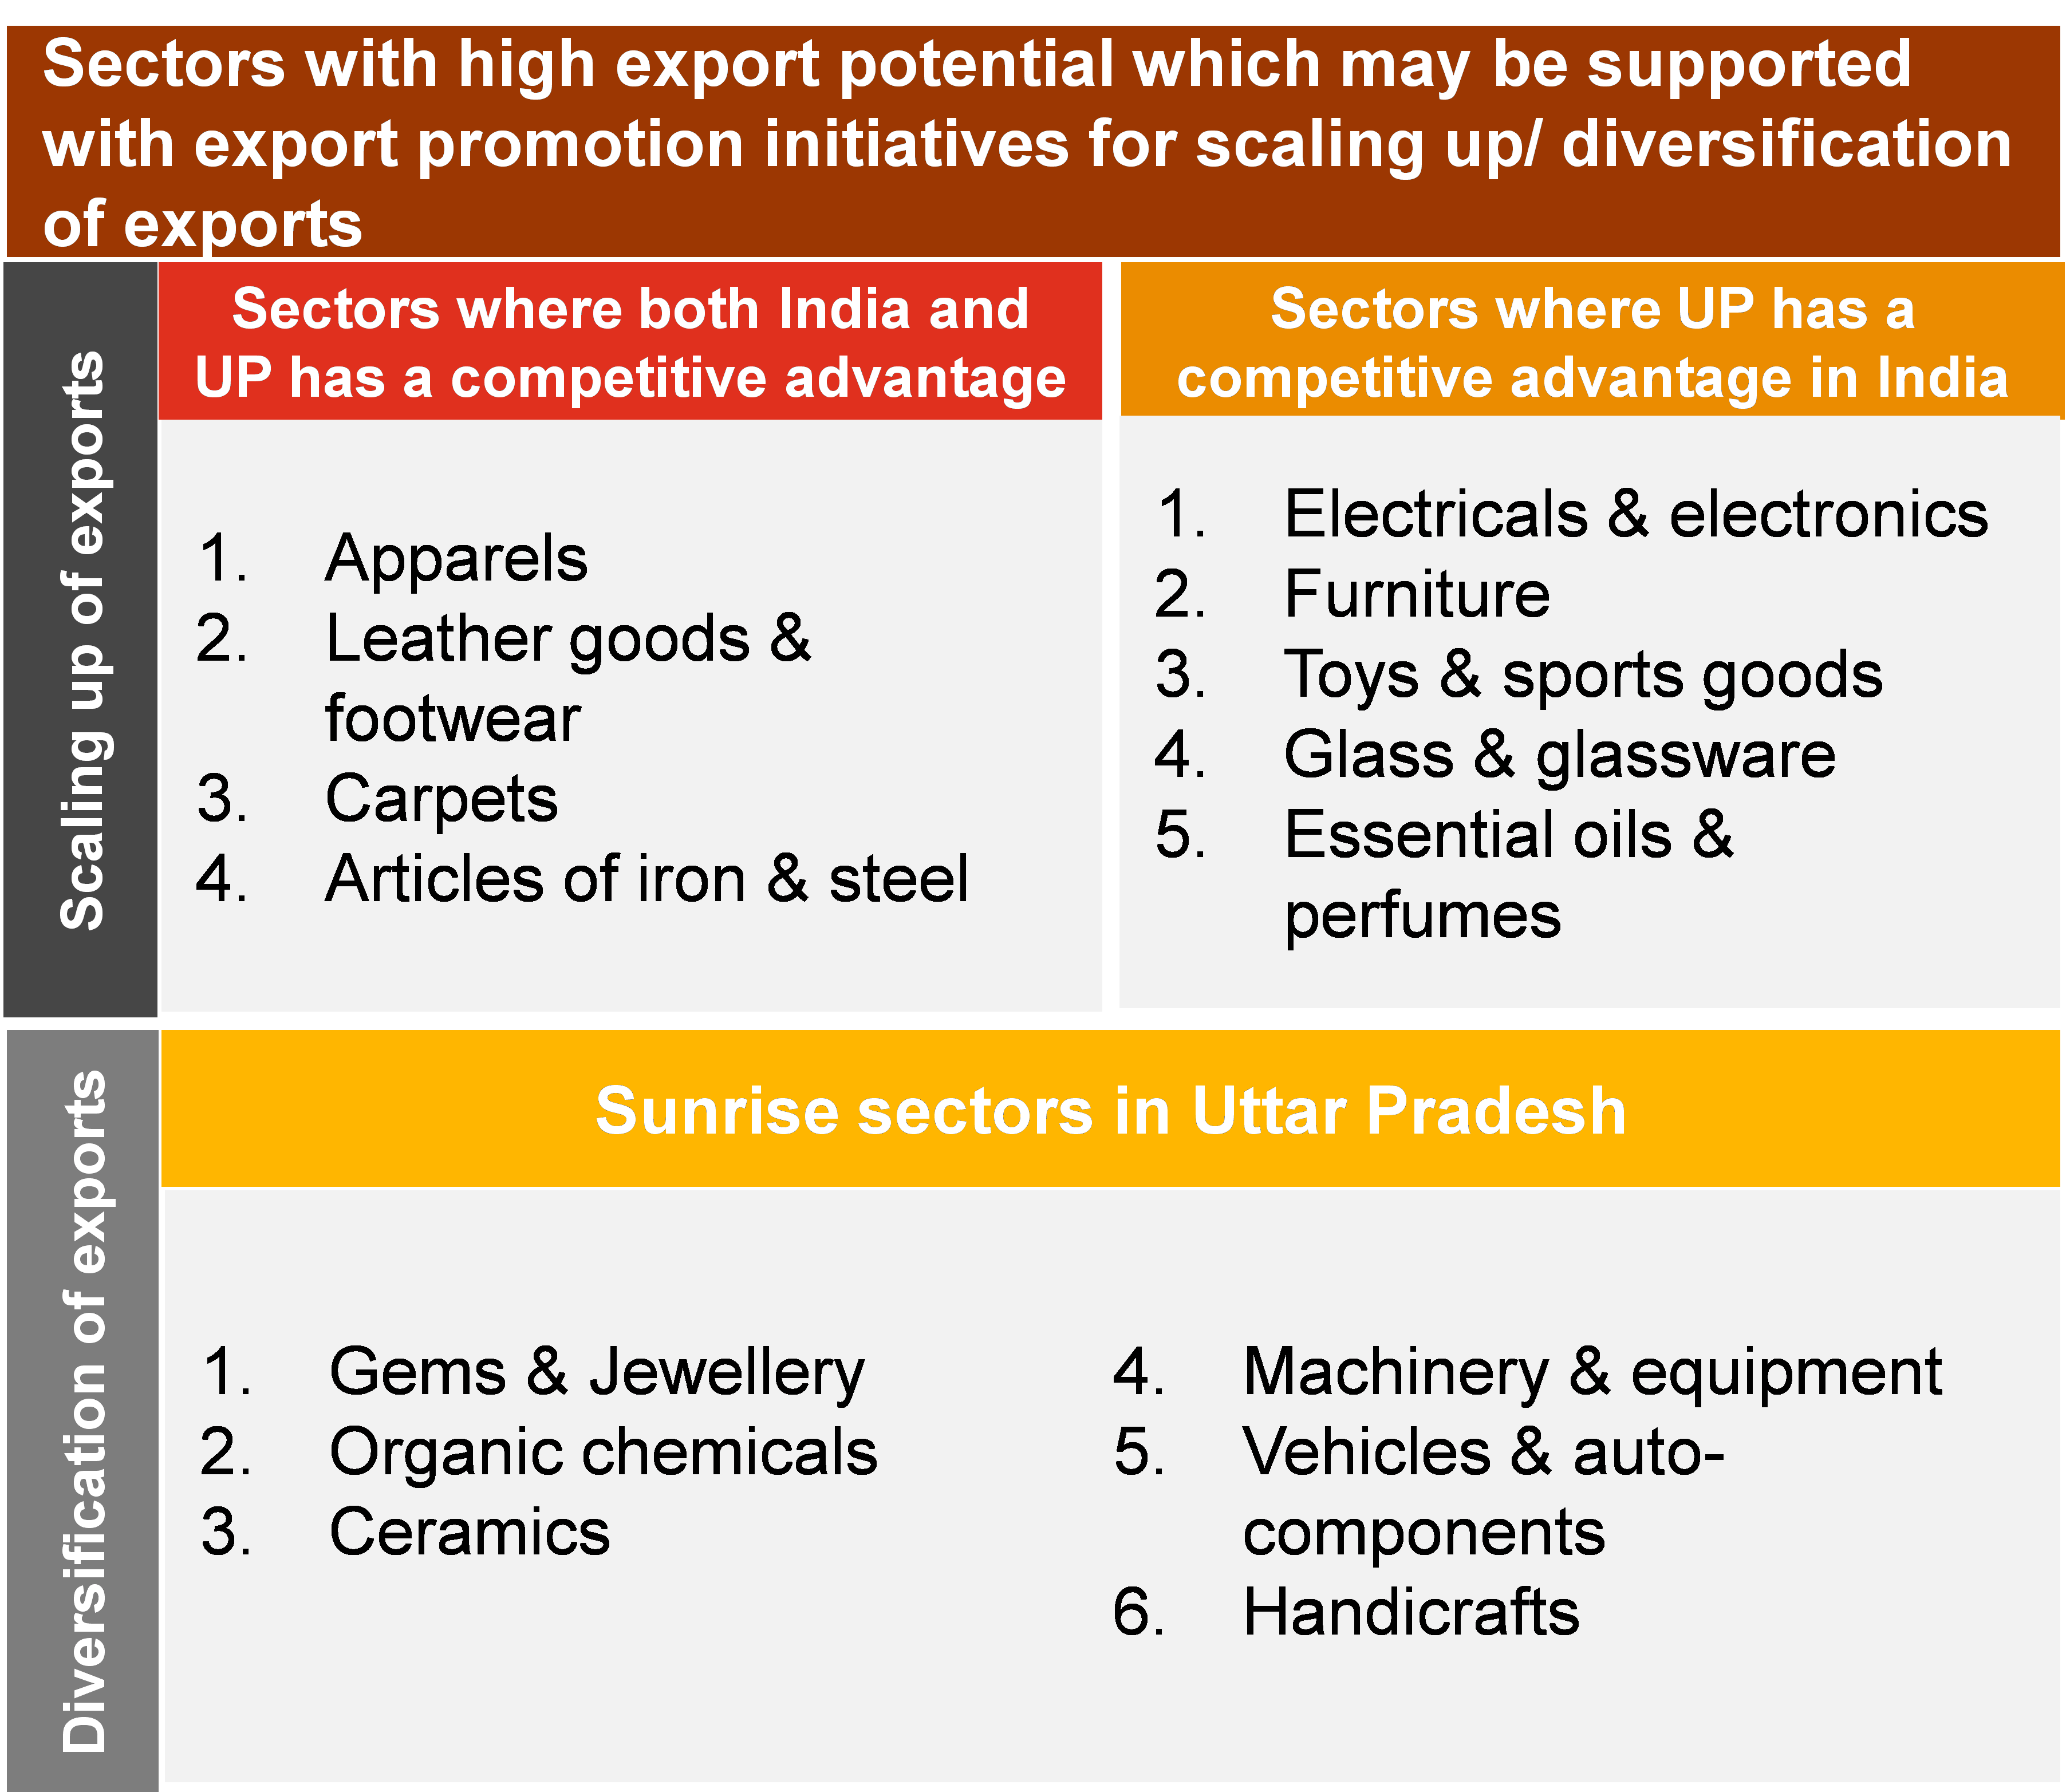
Nigeria and India have a strong bilateral relationship, wherein Nigeria is the largest trading partner among all the African countries for India and also India is the largest trading partner for Nigeria. Of the total crude oil traded by Nigeria, India is the largest buyer among all the other countries. Uttar Pradesh’s export capabilities in select sectors resonates with the consumer demands in Nigeria. At a global level, the priority sectors are classified on based on their RCA scores to identify the relevant export promotion strategies. The traditional sectors for which UP has a competitive advantage are selected for scaling up globally. Similarly, the sunrise sectors are selected for product development and market diversification to boost exports as shown in Figure 5. Also, the state government has shortlisted products with a high export potential for each district of the state under the ‘Districts as Export Hubs’ initiative.
At a country level, the export trends are analyzed to identify country level strategies for export promotion as described in table 3. Further, to support exporters of the state in scaling of exports, the government of Uttar Pradesh through Export Promotion Bureau – Uttar Pradesh and Uttar Pradesh Export Promotion Council has planned to undertake the following initiatives: 1. Identifying and connecting with Sectoral bodies (for priority sectors) 2. Identifying importers and their sourcing needs 3. List of key events where UP's exporters shall participate 4. Facilitate visit of Importers to UP in key trade events that may be organized by Government of Uttar Pradesh 5. Identification of online platforms where UP's exporters should register for exporting their products to meet sourcing requirements of the market
| Exporters | Imported value in 2018 | Imported value in 2019 | Imported value in 2020 | 3 year average | % share |
|---|---|---|---|---|---|
| Total | 36,477 | 47,387 | 53,010 | 45,625 | 100% |
| China | 7,080 | 12,065 | 15,244 | 11,463 | 25% |
| United States of America | 2,680 | 4,680 | 4,803 | 4,054 | 9% |
| India | 1,908 | 5,705 | 4,210 | 3,941 | 9% |
| Netherlands | 4,161 | 3,494 | 4,136 | 3,930 | 9% |
| Belgium | 3,083 | 2,377 | 1,992 | 2,484 | 5% |
| Korea, Republic of | 3,950 | 1,015 | 1,006 | 1,990 | 4% |
| Germany | 991 | 1,457 | 1,657 | 1,369 | 3% |
| United Kingdom | 921 | 1,345 | 1,158 | 1,141 | 3% |
| France | 1,048 | 957 | 1,039 | 1,015 | 2% |
| Russian Federation | 862 | 741 | 1,190 | 931 | 2% |
| Italy | 668 | 873 | 1,142 | 894 | 2% |
| United Arab Emirates | 409 | 1,199 | 1,060 | 889 | 2% |
| Brazil | 656 | 705 | 1,126 | 829 | 2% |
| Spain | 653 | 554 | 716 | 641 | 1% |
| Eswatini | 93 | 1,557 | 213 | 621 | 1% |
| Japan | 310 | 721 | 610 | 547 | 1% |
| Malaysia | 490 | 480 | 654 | 542 | 1% |
| South Africa | 436 | 481 | 619 | 512 | 1% |
| Denmark | 80 | 392 | 1,025 | 499 | 1% |
| Turkey | 311 | 442 | 696 | 483 | 1% |
| HS Code | Product Description | Imported value in 2018 | Imported value in 2019 | Imported value in 2020 | 3 year average | % share |
|---|---|---|---|---|---|---|
| 'TOTAL | All products | 36,477 | 47,387 | 53,010 | 45,625 | 100% |
| 27 | Mineral fuels, mineral oils and products of their distillation; bituminous substances; mineral waxes | 10,838 | 7,374 | 8,103 | 8,772 | 13% |
| 84 | Machinery, mechanical appliances, nuclear reactors, boilers; parts thereof | 5,173 | 8,969 | 9,874 | 8,005 | 11% |
| 87 | Vehicles other than railway or tramway rolling stock, and parts and accessories thereof | 2,242 | 5,628 | 5,334 | 4,401 | 9% |
| 85 | Electrical machinery and equipment and parts thereof; sound recorders and reproducers, television image and sound recorders and reproducers, and parts and accessories of such articles | 2,056 | 3,719 | 3,698 | 3,158 | 9% |
| 39 | Plastics and articles thereof | 1,385 | 1,531 | 2,400 | 1,772 | 4% |
| 90 | Optical, photographic, cinematographic, measuring, checking, precision, medical or surgical instruments and apparatus; parts and accessories thereof | 547 | 3,357 | 1,160 | 1,688 | 4% |
| 30 | Pharmaceutical products | 514 | 1,453 | 2,838 | 1,602 | 3% |
| 10 | Cereals | 1,208 | 1,302 | 2,228 | 1,579 | 3% |
| 89 | Ships, boats and floating structures | 3,426 | 764 | 272 | 1,487 | 2% |
| 3 | Fish and crustaceans, molluscs and other aquatic invertebrates | 686 | 790 | 1,269 | 915 | 2% |
| 38 | Miscellaneous chemical products | 617 | 754 | 1,344 | 905 | 2% |
| 73 | Articles of iron or steel | 682 | 1,005 | 944 | 877 | 2% |
| 72 | Iron and steel | 619 | 683 | 1,131 | 811 | 2% |
| 29 | Organic chemicals | 559 | 658 | 1,032 | 749 | 2% |
| 17 | Sugars and sugar confectionery | 520 | 546 | 834 | 633 | 2% |
| 70 | Glass and glassware | 48 | 1,508 | 57 | 537 | 1% |
| 48 | Paper and paperboard; articles of paper pulp, of paper or of paperboard | 432 | 458 | 666 | 519 | 1% |
| 4 | Dairy produce; birds' eggs; natural honey; edible products of animal origin, not elsewhere specified or included | 317 | 381 | 838 | 512 | 1% |
| 49 | Printed books, newspapers, pictures and other products of the printing industry; manuscripts, typescripts and plans | 124 | 884 | 476 | 495 | 1% |
| 19 | Preparations of cereals, flour, starch or milk; pastrycooks' products | 279 | 461 | 550 | 430 | 1% |
| 33 | Essential oils and resinoids; perfumery, cosmetic or toilet preparations | 277 | 321 | 568 | 389 | 1% |
| 28 | Inorganic chemicals; organic or inorganic compounds of precious metals, of rare-earth metals, of radioactive elements or of isotopes | 296 | 303 | 547 | 382 | 1% |
| 21 | Miscellaneous edible preparations | 258 | 269 | 505 | 344 | 1% |
| 40 | Rubber and articles thereof | 298 | 412 | 318 | 342 | 1% |
| 15 | Animal or vegetable fats and oils and their cleavage products; prepared edible fats; animal or vegetable waxes | 202 | 235 | 399 | 279 | 1% |
| 22 | Beverages, spirits and vinegar | 201 | 315 | 303 | 273 | 1% |
| 76 | Aluminium and articles thereof | 199 | 229 | 340 | 256 | 1% |
| 32 | Tanning or dyeing extracts; tannins and their derivatives; dyes, pigments and other colouring matter; paints and varnishes; putty and other mastics; inks | 191 | 193 | 337 | 240 | 1% |
| 11 | Products of the milling industry; malt; starches; inulin; wheat gluten | 104 | 175 | 431 | 237 | 1% |
| Others | 2,179 | 2,710 | 4,215 | 3,035 | 7% |
| HS Code (6 digit) | Product Description | Share in Nigeria’s import at the HS 2 level | Average share in global imports at HS2 level | Global exports by India | India’s share in global exports | Global exports by Uttar Pradesh |
|---|---|---|---|---|---|---|
| HS 84 – Machinery, mechanical appliances and equipment | ||||||
| 848180 | Appliances for pipes, boiler shells, tanks, vats or the like (excluding pressure-reducing valves, valves for the control of pneumatic power transmission, check "non-return" valves and safety or relief valves) | 2.9% | 2.4% | 806.40 | 1.5% | 15 |
| 841989 | Machinery, plant or laboratory equipment, whether or not electrically heated, for the treatment of materials by a process involving a change of temperature such as heating, cooking, roasting, sterilising, pasteurising, steaming, evaporating, vaporising, condensing or cooling, n.e.s. (excluding machinery used for domestic purposes and furnaces, ovens and other equipment of heading 8514) | 2.7% | 0.4% | 184.50 | 2.1% | 3.6 |
| 846490 | Machine tools for working stones, concrete, asbestos cement or similar mineral substances or for cold-working glass (excluding sawing machines, grinding machines, polishing machines, hand-operated machines and machines for scribing or scoring semiconductor wafers) | 2.7% | 0.1% | 1.21 | 0.1% | 0.8 |
| 842230 | Machinery for filling, closing, sealing or labelling bottles, cans, boxes, bags or other containers; machinery for capsuling bottles, jars, tubes and similar containers; machinery for aerating beverages | 2.6% | 0.4% | 105.79 | 1.2% | 2.73 |
| 841510 | Window or wall air conditioning machines, self-contained or "split-system" | 2.5% | 0.7% | 44.57 | 0.3% | 3.55 |
| 848120 | Valves for oleohydraulic or pneumatic transmission | 1.9% | 0.5% | 53.18 | 0.5% | 13.22 |
| 843710 | Machines for cleaning, sorting or grading seed, grain or dried leguminous vegetables | 1.8% | 0.0% | 19.87 | 3.2% | 1.46 |
| 842481 | Agricultural or horticultural mechanical appliances, whether or not hand-operated, for projecting, dispersing or spraying liquids or powders | 1.8% | 0.0% | 0 | 0.0% | 0 |
| 841381 | Pumps for liquids, power-driven (excluding those of subheading 8413.11 and 8413.19, fuel, lubricating or cooling medium pumps for internal combustion piston engine, concrete pumps, general reciprocating or rotary positive displacement pumps and centrifugal pumps of all kinds) | 1.7% | 0.2% | 24.68 | 0.6% | 0.56 |
| 845290 | Furniture, bases and covers for sewing machines and parts thereof; other parts of sewing machines | 1.6% | 0.0% | 9.85 | 1.0% | 0.053 |
| Total of 10 commodity | 22.2% | 1250 | 41 | |||
| Rest of the commodities under HS code 84 | 77.8% | 19,947 | 629.73 | |||
| HS 87 – Vehicles & Auto-components | ||||||
| 870333 | Motor cars and other motor vehicles principally designed for the transport of persons, incl. station wagons and racing cars, with compression-ignition internal combustion piston engine "diesel or semi-diesel engine" of a cylinder capacity > 2.500 cm³ (excluding vehicles for the transport of persons on snow and other specially designed vehicles of subheading 8703.10) | 32.8% | 2.0% | 8.28 | 0.03% | 0.15 |
| 871120 | Motorcycles, incl. mopeds, with reciprocating internal combustion piston engine of a cylinder capacity > 50 cm³ but <= 250 cm³ | 23.0% | 0.6% | 1797.1 | 17.80% | 105.5 |
| 870332 | Motor cars and other motor vehicles principally designed for the transport of persons, incl. station wagons and racing cars, with compression-ignition internal combustion piston engine "diesel or semi-diesel engine" of a cylinder capacity > 1.500 cm³ but <= 2.500 cm³ (excluding vehicles for the transport of persons on snow and other specially designed vehicles of subheading 8703.10) | 7.1% | 7.1% | 179.23 | 0.18% | 0.72 |
| 870321 | Motor cars and other motor vehicles principally designed for the transport of persons, incl. station wagons and racing cars, with spark-ignition internal combustion reciprocating piston engine of a cylinder capacity <= 1.000 cm³ (excluding vehicles for the transport of persons on snow and other specially designed vehicles of subheading 8703.10) | 5.2% | 2.9% | 1404.18 | 3.77% | 0.2 |
| Total of top 4 commodities | 68% | 3388.79 | 106.57 | |||
| Rest of the commodities under HS code 87 | 32% | 16,249 | 506.9 | |||
| HS 85 – Electricals & electronics | ||||||
| 851762 | Machines for the reception, conversion and transmission or regeneration of voice, images or other data, incl. switching and routing apparatus (excluding telephone sets, telephones for cellular networks or for other wireless networks) | 14.2% | 5.8% | 568.49 | 0.4% | 4.8 |
| 850440 | Static converters | 7.5% | 2.1% | 995.31 | 1.6% | 13.2 |
| 852872 | Reception apparatus for television, colour, whether or not incorporating radio-broadcast receivers or sound or video recording or reproducing apparatus, designed to incorporate a video display or screen | 5.5% | 1.5% | 7.31 | 0.0% | 0.66 |
| 850239 | Generating sets (excluding wind-powered and powered by spark-ignition internal combustion piston engine) | 4.3% | 0.1% | 19.1 | 0.9% | 0.82 |
| 850211 | Generating sets with compression-ignition internal combustion piston engine "diesel or semi-diesel engine" of an output <= 75 kVA | 4.2% | 0.1% | 57.81 | 3.2% | 0.42 |
| 851770 | Parts of telephone sets, telephones for cellular networks or for other wireless networks and of other apparatus for the transmission or reception of voice, images or other data, n.e.s. | 3.5% | 4.5% | 288.06 | 0.2% | 70.74 |
| 854140 | Photosensitive semiconductor devices, incl. photovoltaic cells whether or not assembled in modules or made up into panels; light emitting diodes (excluding photovoltaic generators) | 3.3% | 1.9% | 168.87 | 0.3% | 6.56 |
| 852871 | Reception apparatus for television, whether or not incorporating radio-broadcast receivers or sound or video recording or reproducing apparatus, not designed to incorporate a video display or screen | 2.7% | 0.3% | 43.19 | 0.5% | 0.21 |
| 850213 | Generating sets with compression-ignition internal combustion piston engine "diesel or semi-diesel engine" of an output > 375 kVA | 2.7% | 0.2% | 91.15 | 2.0% | 2.04 |
| 850212 | Generating sets with compression-ignition internal combustion piston engine "diesel or semi-diesel engine" of an output > 75 kVA but <= 375 kVA | 2.1% | 0.1% | 70.36 | 4.8% | 0.23 |
| Total of top 10 commodities | 50% | 2309.65 | 99.68 | |||
| Rest of the commodities under HS code 85 | 50% | 13,393 | 2,413 | |||
| HS 39 - Plastic and articles | ||||||
| 390210 | Polypropylene, in primary forms | 14.6% | 4.2% | 696.64 | 2.7% | 0.13 |
| 390760 | Poly"ethylene terephthalate", in primary forms | 13.1% | 0.2% | 0 | 0.0% | 0 |
| 390110 | Polyethylene with a specific gravity of < 0,94, in primary forms | 10.5% | 4.1% | 537.38 | 2.2% | 3.9 |
| 390120 | Polyethylene with a specific gravity of >= 0,94, in primary forms | 9.0% | 4.7% | 403.32 | 1.4% | 43.14 |
| 390410 | Poly"vinyl chloride", in primary forms, not mixed with any other substances | 7.1% | 1.9% | 17.55 | 0.2% | 0.02 |
| 390230 | Propylene copolymers, in primary forms | 6.2% | 2.3% | 35.04 | 0.2% | 0.003 |
| 390720 | Polyethers, in primary forms (excluding polyacetals and goods of 3002 10) | 5.0% | 2.0% | 57.26 | 0.4% | 0.33 |
| Total of top 7 commodities | 65.6% | 1747.19 | 47/52 | |||
| Rest of the commodities under HS code 39 | 34.4% | 7,259 | 271 | |||
| HS 90 - Optical, photographic, cinematographic devices | ||||||
| 901819 | Electro-diagnostic apparatus, incl. apparatus for functional exploratory examination or for checking physiological parameters (excluding electro-cardiographs, ultrasonic scanning apparatus, magnetic resonance imaging apparatus and scintigraphic apparatus) | 47.0% | 2.1% | 99.34 | 0.8% | 0.12 |
| 903180 | Instruments, appliances and machines for measuring or checking, not elsewhere specified in chapter 90 (excluding optical) | 6.9% | 4.1% | 101.88 | 0.4% | 3.69 |
| 902620 | Instruments and apparatus for measuring or checking pressure of liquids or gases (excluding regulators) | 5.6% | 1.6% | 61.36 | 0.7% | 0.51 |
| 901890 | Instruments and appliances used in medical, surgical or veterinary sciences, n.e.s. | 4.9% | 9.9% | 266.46 | 0.5% | 6.67 |
| 901831 | Syringes, with or without needles, used in medical, surgical, dental or veterinary sciences | 3.2% | 1.0% | 35.42 | 0.6% | 0.27 |
| Total of top 5 commodities | 67.7% | 564.46 | 11.26% | |||
| Rest of the commodities under HS code 90 | 32.3% | 3,236.43 | 129.26 | |||
| HS 30 – Pharmaceuticals | ||||||
| 300490 | Medicaments consisting of mixed or unmixed products for therapeutic or prophylactic purposes, put up in measured doses "incl. those in the form of transdermal administration" or in forms or packings for retail sale (excluding medicaments containing antibiotics, medicaments containing hormones or steroids used as hormones, but not containing antibiotics, medicaments containing alkaloids or derivatives thereof but not containing hormones or antibiotics and medicaments containing provitamins, vitamins or derivatives thereof used as vitamins) | 41% | 48.6% | 12410.94 | 4.2% | 65.76 |
| 300220 | Vaccines for human medicine | 38% | 4.8% | 729 | 2.46% | 1.59 |
| Total of top 2 commodities | 79% | 13,139.94 | 67.35 | |||
| Rest of the commodities under HS code 90 | 31% | 16,277 | 135 | |||
| HS 10 & 17 – Cereals and Confectionary | ||||||
| 100119 | Durum wheat (excluding seed for sowing) | 49% | 6.1% | 0.4 | 0.01% | .023 |
| 170114 | Raw cane sugar, in solid form, not containing added flavouring or colouring matter (excluding cane sugar of 1701 13) | 24% | 6.8% | 307 | 3.07% | 84.85 |
| Total of top commodity | 73% | 307.4 | 84.87 | |||
| Rest of the commodities under HS code 10 & 17 | 37% | 9,796 | 628.2 | |||
| HS 72 & 73- Iron and Steel Articles | ||||||
| 720827 | Flat-rolled products of iron or non-alloy steel, of a width of >= 600 mm, in coils, simply hot-rolled, not clad, plated or coated, of a thickness of < 3 mm, pickled, without patterns in relief | 10.5% | 0.6% | 15.69 | 0.5% | 0.01 |
| 720839 | Flat-rolled products of iron or non-alloy steel, of a width of >= 600 mm, in coils, simply hot-rolled, not clad, plated or coated, of a thickness of < 3 mm, not pickled, without patterns in relief | 5.9% | 2.3% | 1442.37 | 10.7% | 0.01 |
| 730890 | Structures and parts of structures, of iron or steel, n.e.s. (excluding bridges and bridge-sections, towers and lattice masts, doors and windows and their frames, thresholds for doors, props and similar equipment for scaffolding, shuttering, propping or pit-propping) | 5.1% | 4.9% | 482.87 | 1.3% | 13.4 |
| 720854 | Flat-rolled products of iron or non-alloy steel, of a width of >= 600 mm, not in coils, simply hot-rolled, not clad, plated or coated, of a thickness of < 3 mm, without patterns in relief | 4.2% | 0.1% | 4.04 | 0.7% | 0.013 |
| 720711 | Semi-finished products of iron or non-alloy steel containing, by weight, < 0,25% of carbon, of square or rectangular cross-section, the width measuring < twice the thickness | 3.7% | 1.2% | 397.79 | 5.4% | 0.013 |
| 721012 | Flat-rolled products of iron or non-alloy steel, of a width of >= 600 mm, hot-rolled or cold-rolled "cold-reduced", tinned, of a thickness of < 0,5 mm | 3.4% | 0.8% | 62.12 | 1.2% | 0.01 |
| 730729 | Tube or pipe fittings of stainless steel (excluding cast products, flanges, threaded elbows, bends and sleeves and butt weldings fittings) | 3.1% | 0.4% | 28.96 | 1.1% | 0.4 |
| 730820 | Towers and lattice masts, of iron or steel | 2.8% | 0.6% | 318.86 | 9.1% | 10.26 |
| 730429 | Casing and tubing, seamless, of iron or steel, of a kind used in drilling for oil or gas (excluding products of cast iron) | 2.6% | 0.9% | 13.17 | 0.3% | 0.003 |
| 732111 | Appliances for baking, frying, grilling and cooking and plate warmers, for domestic use, of iron or steel, for gas fuel or for both gas and other fuels (excluding large cooking appliances) | 2.6% | 0.8% | 10.05 | 0.2% | 0.51 |
| Total of top 10 commodities | 43.9% | 2775.92 | 24.63 | |||
| Rest of the commodities under HS code 29 | 56.1% | 16997 | 730.1 | |||
| HS 29 – Organic Chemicals | ||||||
| 292242 | Glutamic acid and its salts | 16.7% | 0.3% | 7.29 | 0.6% | 0.01 |
| 292910 | Isocyanates | 9.3% | 1.3% | 56.81 | 1.0% | 0.25 |
| 291570 | Palmitic acid, stearic acid, their salts and esters | 4.8% | 0.2% | 143.78 | 15.4% | 3.1 |
| 292429 | Cyclic amides, incl. cyclic carbamates, and their derivatives; salts thereof (excluding ureines and their derivatives, salts thereof, 2-acetamidobenzoic acid "N-acetylanthranilic acid" and its salts and ethinamate "INN") | 4.4% | 1.3% | 268.89 | 4.8% | 0.01 |
| 291531 | Ethyl acetate | 3.1% | 0.3% | 102.54 | 8.1% | 6.91 |
| 291814 | Citric acid | 2.5% | 0.3% | 2.93 | 0.3% | 0.02 |
| 291732 | Dioctyl orthophthalates | 2.5% | 0.1% | 0.97 | 0.2% | 0 |
| 294110 | Penicillins and their derivatives with a penicillanic acid structure; salts thereof | 2.3% | 0.4% | 210.18 | 12.8% | 0.03 |
| 290511 | Methanol "methyl alcohol" | 2.0% | 2.4% | 4.41 | 0.0% | 0.05 |
| 293499 | Nucleic acids and their salts, whether or not chemically defined; heterocyclic compounds (excluding with oxygen only or with nitrogen hetero-atom[s] only, compounds containing in the structure an unfused thiazole ring or a benzothiazole or phenothiazine ring-system, not further fused and aminorex "INN", brotizolam "INN", clotiazepam "INN", cloxazolam "INN", dextromoramide "INN", haloxazolam "INN", ketazolam "INN", mesocarb "INN", oxazolam "INN", pemoline "INN", phendimetrazine "INN", phenmetrazine "INN", sufentanil "INN", and salts thereof, and inorganic or organic compounds of mercury whether or not chemically defined, and products of 3002 10) | 2.0% | 4.2% | 516.03 | 3.0% | 4.75 |
| Total of top 10 commodities | 49.6% | 1313.83 | 15.13 | |||
| Rest of the commodities under HS code 61 & 62 | 50.4% | 17,733 | 539.34 | |||
| HS 70 – Glassware | ||||||
| 701710 | Laboratory, hygienic or pharmaceutical glassware, whether or not graduated or calibrated, of fused quartz or other fused silica (excluding containers for the conveyance or packing of goods, measuring, checking or medical instruments and apparatus of chapter 90) | 90% | 0.9 | 0.4 | 0.2% | 0.003 |
| Total of top commodity | 90% | 0.4 | 0.003 | |||
| Rest of the commodities under HS code 70 | 10% | 855.6 | 206.88 | |||
