Canada is a USD 1.7 Trillion economy. The country is home to 37 million residents , with a high consumption potential. The GDP of the country has shown a significant growth from USD 1.5 Trillion in 2016 to USD 1.7 Trillion in 2019. On an average, the final consumption of the country accounts for around 79% of the GDP whereas the household consumption accounts for around 57% of the GDP, indicating a potential consumer goods market, The population constitutes of ~1.9 million of NRIs and PIOs, indicating a vast Indian diaspora.
Canada in general imports USD 630 Billion worth of products on an average basis. Of that the the leading sectors that contribute to 70% of Canada’s imports are Machinery & equipment, Vehicles & auto-components, Electricals & electronics, mineral fuels, pharmaceuticals, gems and jewelry, Iron and steel articles, Plastics & its articles, furnitures, and Optical, photographic & Cinematographic devices.

| Table 1: Top service contributing to imports of Canada | ||||||
|---|---|---|---|---|---|---|
| Code | Service Label | Imported value in 2017 | Imported value in 2018 | Imported value in 2019 | 3 year average | % share |
| 'TOTAL | All Service | 229,290 | 247,427 | 242,970 | 241,426 | 100% |
| SOX1 | Memo item: Other commercial services | 53,197 | 59,751 | 59,002 | 57,317 | 16% |
| SDZ | Tourism-related services in travel and passenger transport (alternative breakdown) | 41,888 | 42,313 | 43,682 | 42,628 | 15% |
| 4.2.3 | Travel, Personal, Other (other than health and education) | 27,258 | 27,031 | 28,055 | 27,448 | 10% |
| 3a.2 | Freight transport, All modes (alternative breakdown) | 11,041 | 12,447 | 12,130 | 11,873 | 7% |
| 10.2.1.3 | Business and management consulting and public relations services | 10,709 | 11,553 | 11,494 | 11,252 | 4% |
| 3.1.2 | Freight transport, Sea | 9,108 | 10,419 | 10,130 | 9,885 | 3% |
| 7.1 | Explicitly charged and other financial services | 7,483 | 8,358 | 7,730 | 7,857 | 3% |
| 3a.1 | Passenger transport, All modes (alternative breakdown) | 7,210 | 7,787 | 7,900 | 7,632 | 3% |
| 3.2.1 | Passenger transport, Air | 6,959 | 7,511 | 7,630 | 7,367 | 2% |
| 8.2 | Licences for the use of outcomes of research and development | 5,956 | 6,167 | 5,986 | 6,036 | 2% |
| 4.1 | Travel, Business | 4,229 | 4,192 | 4,392 | 4,271 | 2% |
| 3a.3 | Other transport (other than passenger and freight), All modes (alternative breakdown) | 4,062 | 4,332 | 4,399 | 4,264 | 2% |
| 9.2 | Computer services | 3,063 | 4,281 | 4,156 | 3,833 | 1% |
| 10.3.1.3 | Scientific and other technical services | 3,033 | 3,656 | -- | 3,344 | 1% |
| 8.3 | Licences to reproduce and/or distribute computer software | 2,698 | 3,389 | 3,289 | 3,125 | 1% |
| 4.2.2 | Travel, Personal, Education-related | 2,660 | 2,771 | 2,814 | 2,749 | 1% |
| 6.2 | Reinsurance | 2,277 | 2,588 | 2,547 | 2,471 | 1% |
| 11.1 | Audiovisual and related services | 2,241 | 2,422 | 2,609 | 2,424 | 1% |
| 3.2.3 | Other transport, Air (other than passenger and freight) | 2,278 | 2,422 | 2,503 | 2,401 | 1% |
| 8.1 | Franchises and trademarks licensing fees | 2,149 | 2,049 | 1,988 | 2,062 | 1% |
| 3.3.2 | Other modes of transport, Freight | 1,933 | 2,028 | 2,000 | 1,987 | 1% |
| 10.3.5 | Other business services n.i.e. | 1,358 | 1,625 | 1,755 | 1,579 | 1% |
| 9.1 | Telecommunications services | 1,510 | 1,493 | 1,440 | 1,481 | 1% |
| 10.1 | Research and development (R&D) | 1,207 | 1,542 | 1,513 | 1,421 | 1% |
| 10.2.2 | Advertising, market research, and public opinion polling services | 1,082 | 1,410 | 1,390 | 1,294 | 1% |
| 6.1 | Direct insurance | 1,150 | 1,305 | 1,284 | 1,247 | 1% |
| 9.3 | Information services | 1,318 | 1,198 | 1,163 | 1,226 | 1% |
| -- | Others | 10,236 | 11,386 | 9,990 | 10,953 | 5% |
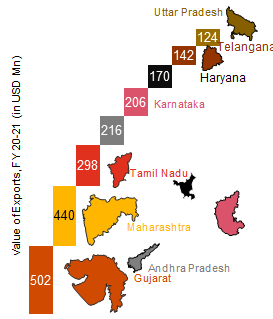
India exports an average of USD 2.4 Billion worth of goods to Canada per year. India’s share in the country’s imports have increased from 0.7% in 2017 to 0.9% in 2020, exported commodities worth USD 2.7 Billion last year. Gujarat, Maharashtra, Tamil Nadu, Andhra Pradesh, Karnataka, Haryana, Telangana and Uttar Pradesh are the top 8 states of India in terms of exports to Canada, contributing approximately 77% of India’s exports to Canada.
India’s exports to Canada are characterized by exports of the following top 10 sectors: Mineral fuels & oils, gems & Jewellery, pharmaceuticals, machinery, apparels & textiles, electricals & electronics, footwear, vehicles & auto-components, organic chemicals, aircrafts etc. as shown in table below. The table also discusses the percentage share of the sector in India’s exports to Canada and the contribution of India’s exports in Canada’s total imports of that sector at a HS 2 level. The sectors highlighted in yellow are the key sectors identified for driving exports growth from Uttar Pradesh.
|
|
|||
|---|---|---|---|
| Sector | India’s exports to Canada, (USD Mn) | % share of sector in India’s exports globally | % share of India’s exports to Canada’s imports |
| HS 30, Pharmaceuticals | 284 | 5.3% | 10.4% |
| HS 72 & 73 Iron and Steel Articles | 349 | 6.5% | 12.8% |
| HS 29, Organic Chemicals | 202 | 5.7% | 7.4% |
| HS 84, Machinery & Equipment | 173 | 6.4% | 6.4% |
| HS 71, Gems & Jewellery | 139 | 10.2% | 5.1% |
| HS 63 Other made-up textile | 128 | 1.6% | 4.7% |
| HS 87, Vehicles & Auto-components | 121 | 4.9% | 4.5% |
| HS 61 & 62, Apparels | 189 | 4.4% | 7.0% |
| HS 39 Plastic and Articles | 105 | 2.3% | 3.9% |
| HS 03 Fish and invertebrates | 100 | 1.8% | 3.7% |
| Total exports (3 year average) | USD 4.6 Bn | ||
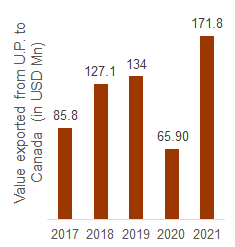
The exports from Uttar Pradesh to Canada grew at a CAGR of 10.7% in the last 5 years. Uttar Pradesh exported a total of USD 172 Million value of commodities to Canada in 2021. With such a high CAGR and the post the COVID impact in 2020, the exports from UP to Canada accelerated by approximately 161% in 2021, indicating a high potential for growth in the future.
12 select sectors contributed to approximately 82% of UP’s exports to Canada during the last 3 years. These are the sectors that have the highest export percentage that other products that are being imported by Canada from UP. The table below summarizes the top 12 products exported from UP to Canada:
| Top commodities exported from UP to Canada | |||||
|---|---|---|---|---|---|
| HS code | Product description | Value of Exports (in USD Mn) | % share in UP’s exports to Canada | Growth rate of exports from UP to Canada | Growth rate of exports from UP to all markets |
| 72 & 73 | Iron and Steel Articles | 736.3 | 13% | 30.2% | 50.6% |
| 61 & 62 | Apparels | 1,489.1 | 13.3% | -18.1% | -4.8% |
| 85 | Electricals & Electronics | 2,773.9 | 7.1% | -2.8% | 9.4% |
| 57 | Carpets and other textile floor coverings | 546.5 | 5.3% | -11.1% | 9.5% |
| 42 & 64 | Footwear and leather goods | 1,044.3 | 9.5% | -11.8% | 2% |
| 76 | Aluminium and articles thereof | 556.2 | 4.6% | -0.2% | 8.2% |
| 94 | Furnitures | 347 | 4.6% | 11.1% | 36.8% |
| 44 | Wood and articles of wood | 200.2 | 4.5% | 2.8% | 33.3% |
| 10 | Cereals | 435.7 | 3.5% | -5.9% | 38.6% |
| 29 | Organic Chemicals | 483.7 | 3.4% | -11.6% | -1.8% |
| 63 | Other made-up textile articles | 221.5 | 3.3% | 1.5% | 11.1 |
| 39 | Plastic and Articles | 223.4 | 3.1% | -1.0% | 3.7% |
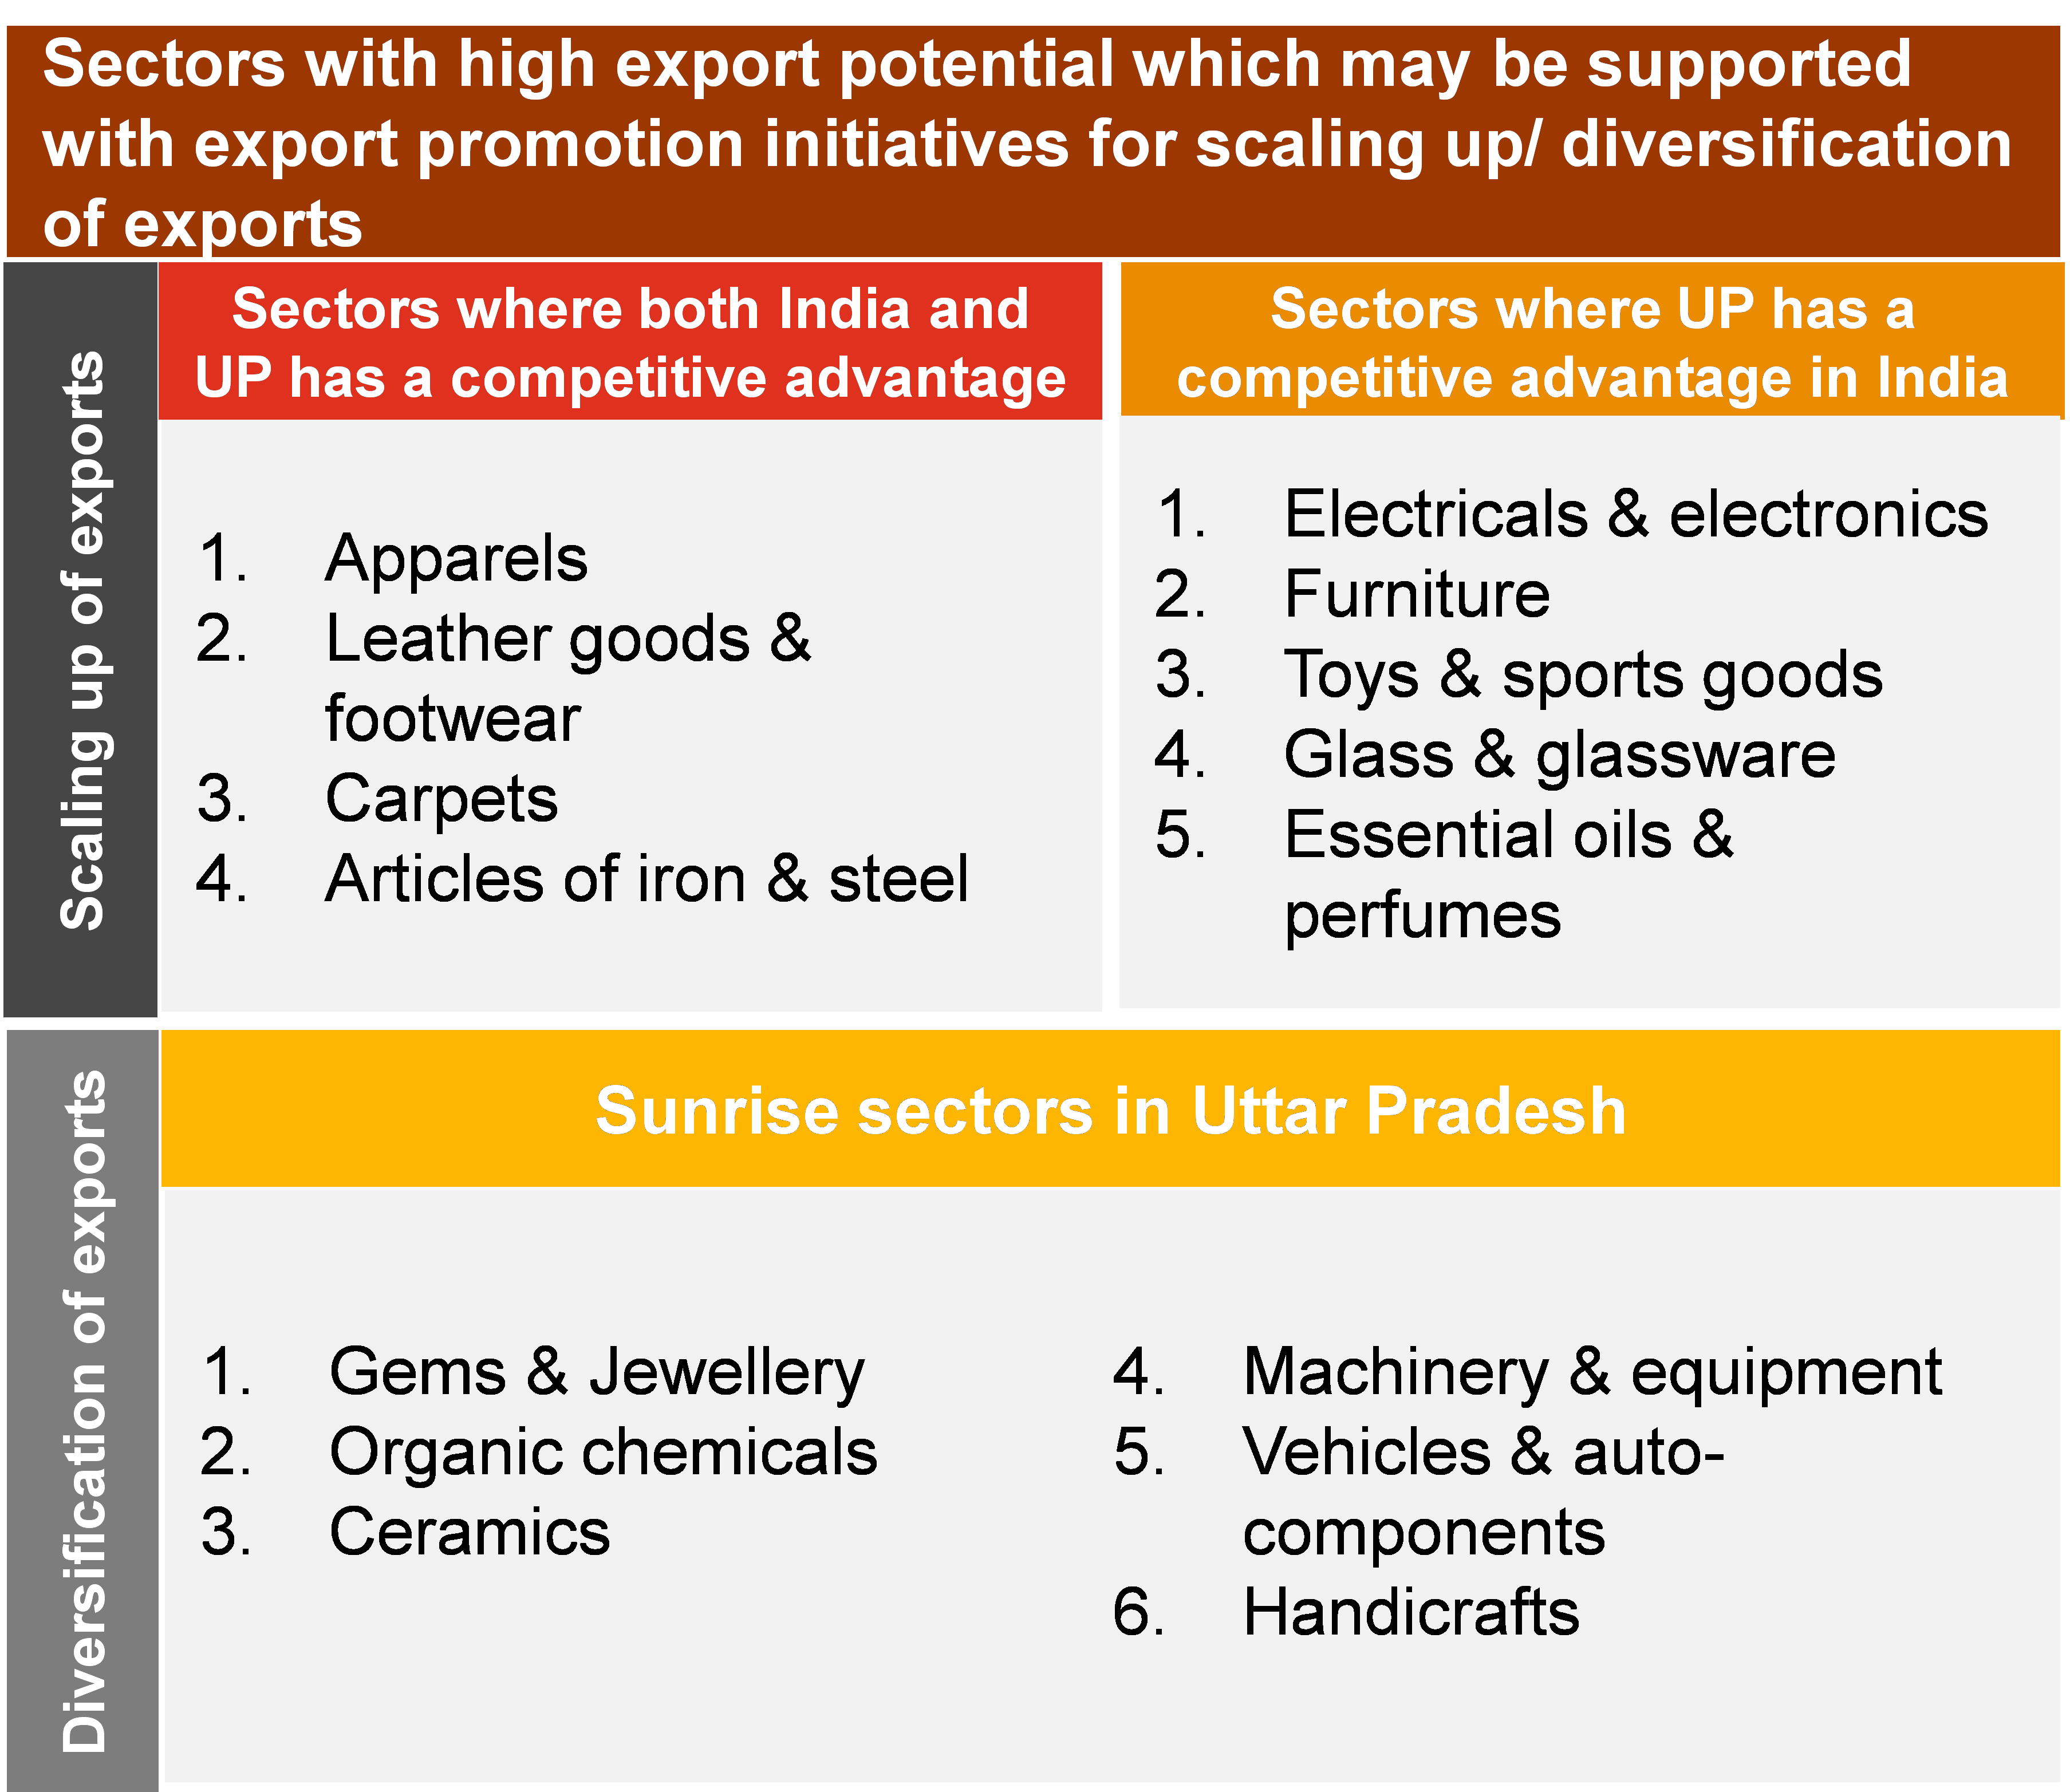
Select sectors are identified as potential opportunities which may drive growth of exports from Uttar Pradesh to Canada. The sectors are selected based on the import demand in Canada, India’s exports to Canada and UP’s exports to Canada. Further, the priority sectors shortlisted are classified into two categories, based on the relevant strategy for export promotion. The sectors with significant manufacturing and exports volume to Canada are strategically selected for scaling up of exports. The sectors with appreciable manufacturing volume, but low level of exports from UP to Canada are selected for market diversification into Canada.
The table below summarizes the top 10 sectors shortlisted for UP’s exporters who intend to undertake exports in Canada. Electricals & electronics, Articles of Iron & steel, Furniture and apparels sector are shortlisted for scaling up of exports. Machinery & equipment, auto-components, plastics & plastic articles, gems & Jewellery, pharmaceutics and Organic chemicals are shortlisted for diversification. A comprehensive detail for the select 10 sectors at a HS 6 level is described in annexure 3. Potential sectors for driving UP’s exports growth in Canada HS Code Product Description Value imported by CANADA (USD Mn) Exports from India to CANADA (USD Mn) UP’s exports to CANADA (USD Mn) Potential intervention strategy 84 Machinery & Equipment 66,431 173.1 2.4 Diversification 87 Vehicles & Auto-components 68,600 121.3 1.1 Diversification 85 Electrical & Electronics 42,873 60.7 8.8 Scale up 39 Plastics and articles 16,446 105.3 3.8 Diversification 71 Gems and Jewelry 12,173 139.1 2.9 Diversification 30 Pharmaceuticals 13,573 283.6 0.8 Diversification 72 & 73 Iron and Steel articles 16,475 226.7 16.1 Scale up 94 Furnitures 8,940 39.9 5.7 Scale up 29 Organic Chemicals 6,339 201.7 4.3 Diversification 61 & 62 Apparels 9,474 189 16.5 Scale up For select sectors, Uttar Pradesh’s export capabilities shall be leveraged to cater to the consumer demands in Canada. GoUP has identified such sectors from an exhaustive demand analysis. The priority sectors are classified on based on their RCA scores to identify the relevant export promotion strategies. The traditional sectors for which UP has a competitive advantage are selected for scaling up globally. Similarly, the sunrise sectors are selected for product development and market diversification to boost exports, as shown in Figure 5. Further, to support exporters of the state in scaling of exports, the government of Uttar Pradesh through Export Promotion Bureau – Uttar Pradesh and Uttar Pradesh Export Promotion Council has planned to undertake the following initiatives: 1. Identifying and connecting with Sectoral bodies (for priority sectors) based in Canada 2. Identifying importers and their sourcing needs 3. List of key events where UP's exporters shall participate 4. Facilitate visit of Canada’s Importers to UP in key trade events that may be organized by Government of Uttar Pradesh 5. Identification of online platforms where UP's exporters should register for exporting their products to meet sourcing requirements of Canada’s importers
| Potential sectors for driving UP’s exports growth in Canada | |||||
|---|---|---|---|---|---|
| HS code | Product Description | Value imported by CANADA (USD Mn) | Exports from India to CANADA (USD Mn) | UP’s exports to CANADA (USD Mn) | Potential intervention strategy |
| 84 | Machinery & Equipment | 66,431 | 173.1 | 2.4 | Diversification |
| 87 | Vehicles & Auto-components | 68,600 | 121.3 | 1.1 | Diversification |
| 85 | Electrical & Electronics | 42,873 | 60.7 | 8.8 | Scale up |
| 39 | Plastics and articles | 16,446 | 105.3 | 3.8 | Diversification |
| 71 | Gems and Jewelry | 12,173 | 139.1 | 2.9 | Diversification |
| 30 | Pharmaceuticals | 13,573 | 283.6 | 0.8 | Diversification |
| 72 & 73 | Iron and Steel articles | 16,475 | 226.7 | 16.1 | Scale up |
| 94 | Furnitures | 8,940 | 39.9 | 5.7 | Scale up |
| 29 | Organic Chemicals | 6,339 | 201.7 | 4.3 | Diversification |
| 61 & 62 | Apparels | 9,474 | 189 | 16.5 | Scale up |
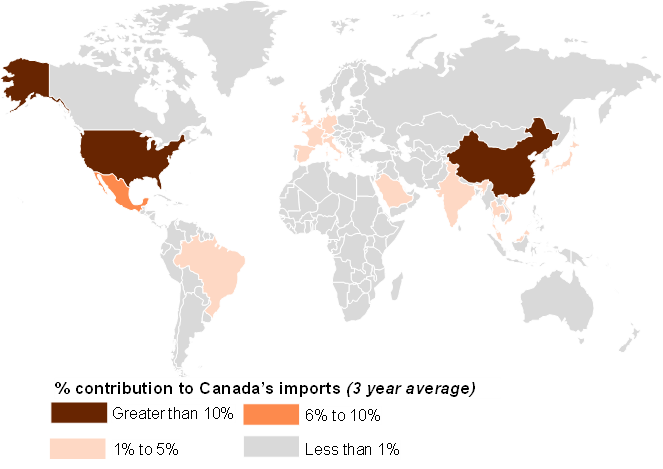
Canada is a USD 440 Bn import market, which is largely serviced by exporters from US and China. Canada’s imports have grown from USD 403 Billion in 2016 to USD 489 Billion in 2021. It had seen a drop to USD 404 Billion in 2020 due to the outbreak of the COVID, that led to disrupted global supply chains, but it bounced back with around 21%, showing high potential in the market
United States contributes the highest to Canadian imports with a whopping 50% of the share, followed by China that holds 13%. The top 10 countries contributing approximately 82% of imports to other than US and Canada are Mexico, Germany, Japan, South Korea, Italy, UK, France and Vietnam. India is the 5th largest exporter to Canada among the Asian countries. On an average, India contributes to 1% of Canada’s imports. A detailed list of key countries exporting to Canada is attached in annexure 01.
(All values in USD Million)
| Exporters | Imported value in 2018 | Imported value in 2019 | Imported value in 2020 | 3 year average | % share |
|---|---|---|---|---|---|
| Total | 460,109 | 453,157 | 404,275 | 439,181 | 100% |
| United States of America | 235,168 | 229,739 | 197,085 | 220,664 | 50% |
| China | 58,344 | 56,516 | 57,044 | 57,302 | 13% |
| Mexico | 28,421 | 27,818 | 22,252 | 26,163 | 6% |
| Germany | 14,735 | 14,488 | 12,890 | 14,038 | 3% |
| Japan | 12,998 | 12,448 | 10,121 | 11,856 | 3% |
| Korea, Republic of | 7,299 | 7,250 | 7,150 | 7,233 | 2% |
| Italy | 6,947 | 7,124 | 6,711 | 6,927 | 2% |
| United Kingdom | 7,107 | 6,927 | 5,807 | 6,614 | 2% |
| France | 5,553 | 6,547 | 4,821 | 5,641 | 1% |
| Viet Nam | 4,159 | 5,265 | 6,078 | 5,167 | 1% |
| Taipei, Chinese | 4,540 | 4,498 | 4,200 | 4,413 | 1% |
| Brazil | 4,254 | 4,068 | 4,904 | 4,409 | 1% |
| India | 3,957 | 4,113 | 3,703 | 3,924 | 1% |
| Switzerland | 3,549 | 3,727 | 4,386 | 3,888 | 1% |
| Belgium | 3,435 | 3,740 | 3,247 | 3,474 | 1% |
| Canada | 3,388 | 3,389 | 2,983 | 3,254 | 1% |
| Netherlands | 3,492 | 3,515 | 2,379 | 3,128 | 1% |
| Thailand | 2,750 | 2,822 | 2,635 | 2,736 | 1% |
| Spain | 2,295 | 2,621 | 2,309 | 2,408 | 1% |
| Ireland | 2,285 | 2,275 | 2,385 | 2,315 | 1% |
| Others | 45,433 | 44,267 | 41,181 | 43,627 | 10% |
(All values in USD Million)
| HS Code | Product Description | Imported value in 2018 | Imported value in 2019 | Imported value in 2020 | 3 year average | % share |
|---|---|---|---|---|---|---|
| 'TOTAL | All products | 439,181 | 439,181 | 439,181 | 439,181 | 100% |
| '87 | Vehicles other than railway or tramway rolling stock, and parts and accessories thereof | 75,417 | 74,437 | 55,946 | 68,600 | 16% |
| '84 | Machinery, mechanical appliances, nuclear reactors, boilers; parts thereof | 68,990 | 69,214 | 61,090 | 66,431 | 15% |
| '85 | Electrical machinery and equipment and parts thereof; sound recorders and reproducers, television image and sound recorders and reproducers, and parts and accessories of such articles | 44,931 | 44,165 | 39,523 | 42,873 | 10% |
| '27 | Mineral fuels, mineral oils and products of their distillation; bituminous substances; mineral waxes | 36,728 | 33,231 | 20,099 | 30,019 | 7% |
| '39 | Plastics and articles thereof | 17,001 | 16,359 | 15,976 | 16,446 | 4% |
| '30 | Pharmaceutical products | 12,559 | 13,857 | 14,303 | 13,573 | 3% |
| '90 | Optical, photographic, cinematographic, measuring, checking, precision, medical or surgical instruments and apparatus; parts and accessories thereof | 12,605 | 12,642 | 11,440 | 12,229 | 3% |
| '71 | Natural or cultured pearls, precious or semi-precious stones, precious metals, metals clad with precious metal, and articles thereof; imitation jewellery; coin | 8,804 | 10,330 | 17,384 | 12,173 | 3% |
| '73 | Articles of iron or steel | 10,811 | 10,325 | 8,821 | 9,986 | 2% |
| '99 | Commodities not elsewhere specified | 9,791 | 9,606 | 9,302 | 9,566 | 2% |
| '94 | Furniture; bedding, mattresses, mattress supports, cushions and similar stuffed furnishings; lamps and lighting fittings, not elsewhere specified or included; illuminated signs, illuminated nameplates and the like; prefabricated buildings | 9,346 | 9,177 | 8,297 | 8,940 | 2% |
| '88 | Aircraft, spacecraft, and parts thereof | 8,410 | 9,016 | 6,182 | 7,869 | 2% |
| '72 | Iron and steel | 7,932 | 6,254 | 5,281 | 6,489 | 1% |
| '29 | Organic chemicals | 6,811 | 6,308 | 5,899 | 6,339 | 1% |
| '40 | Rubber and articles thereof | 6,468 | 6,296 | 5,674 | 6,146 | 1% |
| '38 | Miscellaneous chemical products | 5,471 | 5,295 | 5,914 | 5,560 | 1% |
| '48 | Paper and paperboard; articles of paper pulp, of paper or of paperboard | 5,669 | 5,581 | 5,405 | 5,552 | 1% |
| '22 | Beverages, spirits and vinegar | 5,077 | 4,969 | 5,009 | 5,018 | 1% |
| '61 | Articles of apparel and clothing accessories, knitted or crocheted | 5,081 | 5,328 | 4,348 | 4,919 | 1% |
| '08 | Edible fruit and nuts; peel of citrus fruit or melons | 4,788 | 4,801 | 4,966 | 4,852 | 1% |
| '62 | Articles of apparel and clothing accessories, not knitted or crocheted | 4,597 | 4,776 | 4,292 | 4,555 | 1% |
| '28 | Inorganic chemicals; organic or inorganic compounds of precious metals, of rare-earth metals, of radioactive elements or of isotopes | 4,400 | 4,198 | 4,391 | 4,330 | 1% |
| '95 | Toys, games and sports requisites; parts and accessories thereof | 4,459 | 4,189 | 4,097 | 4,248 | 1% |
| '76 | Aluminium and articles thereof | 4,493 | 4,017 | 3,745 | 4,085 | 1% |
| '33 | Essential oils and resinoids; perfumery, cosmetic or toilet preparations | 3,825 | 3,766 | 3,524 | 3,705 | 1% |
| '07 | Edible vegetables and certain roots and tubers | 3,135 | 3,367 | 3,369 | 3,290 | 1% |
| '19 | Preparations of cereals, flour, starch or milk; pastrycooks' products | 3,039 | 3,174 | 3,318 | 3,177 | 1% |
| '26 | Ores, slag and ash | 3,207 | 2,980 | 2,788 | 2,991 | 1% |
| -- | Others | 66,264 | 65,501 | 63,892 | 65,219 | 15% |
(All values in USD Million)
| HS Code (6 digit) | Product Description | Share in Canada’s import at the HS 2 level | Average share in global imports at HS2 level | Global exports by India | India’s share in global exports | Global exports by Uttar Pradesh |
|---|---|---|---|---|---|---|
| HS 84 - Machinery, mechanical appliances and equipment | ||||||
| '847130 | Data-processing machines, automatic, portable, weighing <=1 0 kg, consisting of at least a central processing unit, a keyboard and a display (excluding peripheral units) |
7.0% | 6.9% | 48.76 | 0.0% | 0.8 |
| '840734 | Spark-ignition reciprocating piston engine, of a kind used for vehicles of chapter 87, of a cylinder capacity > 1.000 cm³ | 6.0% | 1.5% | 133.14 | 0.4% | 0.001 |
| '841191 | Parts of turbojets or turbopropellers, n.e.s. | 4.8% | 3.2% | 109.68 | 0.2% | 0 |
| '847150 | Processing units for automatic data-processing machines, whether or not containing in the same housing one or two of the following types of unit: storage units, input units, output units (excluding those of heading 8471.41 or 8471.49 and excluding peripheral units) |
3.4% | 3.6% | 45.01 | 0.1% | 0.4 |
| '848180 | Appliances for pipes, boiler shells, tanks, vats or the like (excluding pressure-reducing valves, valves for the control of pneumatic power transmission, check "non-return" valves and safety or relief valves) |
3.3% | 2.4% | 806.40 | 1.5% | 13.2 |
| '840991 | Parts suitable for use solely or principally with spark-ignition internal combustion piston engine, n.e.s. | 2.4% | 1.4% | 298.48 | 1.0% | 23 |
| '843149 | Parts of machinery of heading 8426, 8429 and 8430, n.e.s. | 2.0% | 1.1% | 358.27 | 1.5% | 20.4 |
| '848340 | Gears and gearing for machinery (excluding toothed wheels, chain sprockets and other transmission elements presented separately); ball or roller screws; gear boxes and other speed changers, incl. torque converters |
1.8% | 0.8% | 476.83 | 2.4% | 21.3 |
| '842952 | Self-propelled mechanical shovels, excavators and shovel loaders, with a 360° revolving superstructure | 1.7% | 1.0% | 159.55 | 0.7% | 1.6 |
| '842139 | Machinery and apparatus for filtering or purifying gases (excluding isotope separators and intake air filters for internal combustion engines) |
1.6% | 1.1% | 129.30 | 0.5% | 3.3 |
| Total of 10 commodity | 34.1% | 2565.42 | 84 | |||
| Rest of the commodities under HS code 84 | 65.9% | 19,901 | 557 | |||
| HS 87 - Vehicles & Auto-components | ||||||
| '870323 | Motor cars and other motor vehicles principally designed for the transport of persons, incl. station wagons and racing cars, with spark-ignition internal combustion reciprocating piston engine of a cylinder capacity > 1.500 cm³ but <=3 .000 cm³ (excluding vehicles for the transport of persons on snow and other specially designed vehicles of subheading 8703.10) |
19.5% | 18.4% | 1767.59 | 0.7% | 0.2 |
| '870431 | Motor vehicles for the transport of goods, with spark-ignition internal combustion piston engine, of a gross vehicle weight <=5 t (excluding dumpers for off-highway use of subheading 8704.10 and special purpose motor vehicles of heading 8705) |
12.9% | 2.3% | 6.21 | 0.0% | 0 |
| '870324 | Motor cars and other motor vehicles principally designed for the transport of persons, incl. station wagons and racing cars, with spark-ignition internal combustion reciprocating piston engine of a cylinder capacity > 3.000 cm³ (excluding vehicles for the transport of persons on snow and other specially designed vehicles of subheading 8703.10) |
12.3% | 5.9% | 1.85 | 0.0% | 0 |
| '870829 | Parts and accessories of bodies for tractors, motor vehicles for the transport of ten or more persons, motor cars and other motor vehicles principally designed for the transport of persons, motor vehicles for the transport of goods and special purpose motor vehicles (excluding bumpers and parts thereof and safety seat belts) |
7.2% | 5.2% | 151.37 | 0.2% | 0.3 |
| '870899 | Parts and accessories, for tractors, motor vehicles for the transport of ten or more persons, motor cars and other motor vehicles principally designed for the transport of persons, motor vehicles for the transport of goods and special purpose motor vehicles, n.e.s. |
4.7% | 5.9% | 2510.35 | 3.0% | 114.8 |
| '870840 | Gear boxes and parts thereof, for tractors, motor vehicles for the transport of ten or more persons, motor cars and other motor vehicles principally designed for the transport of persons, motor vehicles for the transport of goods and special purpose motor vehicles, n.e.s |
3.7% | 4.6% | 387.71 | 0.6% | 6.1 |
| '870120 | Road tractors for semi-trailers | 3.5% | 2.1% | 44.46 | 0.1% | 6.3 |
| '870322 | Motor cars and other motor vehicles principally designed for the transport of persons, incl. station wagons and racing cars, with spark-ignition internal combustion reciprocating piston engine of a cylinder capacity > 1.000 cm³ but <=1 .500 cm³ (excluding vehicles for the transport of persons on snow and other specially designed vehicles of subheading 8703.10) |
2.3% | 7.9% | 2795.49 | 2.6% | 8.1 |
| Total of top 8 commodities | 66.1% | 7665.03 | 135.8 | |||
| Rest of the commodities under HS code 87 | 33.9% | 16,229 | 441 | |||
| HS 85 - Electrical & Electronics | ||||||
| '851712 | Telephones for cellular networks "mobile telephones" or for other wireless networks | 13.3% | 9.5% | 2496.42 | 0.9% | 1416.3 |
| '851762 | Machines for the reception, conversion and transmission or regeneration of voice, images or other data, incl. switching and routing apparatus (excluding telephone sets, telephones for cellular networks or for other wireless networks) |
9.4% | 5.8% | 568.49 | 0.4% | 3.8 |
| '853710 | Boards, cabinets and similar combinations of apparatus for electric control or the distribution of electricity, for a voltage <=1 .000 V |
3.7% | 2.0% | 412.51 | 0.7% | 14.5 |
| '854430 | Ignition wiring sets and other wiring sets for vehicles, aircraft or ships | 3.4% | 1.4% | 214.92 | 0.6% | 56.2 |
| '850440 | Static converters | 3.1% | 2.1% | 995.31 | 1.6% | 11.4 |
| '852872 | Reception apparatus for television, colour, whether or not incorporating radio-broadcast receivers or sound or video recording or reproducing apparatus, designed to incorporate a video display or screen | 2.7% | 1.5% | 7.31 | 0.0% | 0.6 |
| '854231 | Electronic integrated circuits as processors and controllers, whether or not combined with memories, converters, logic circuits, amplifiers, clock and timing circuits, or other circuits |
2.6% | 12.0% | 84.21 | 0.0% | 27.3 |
| '851220 | Electrical lighting or visual signalling equipment for motor vehicles (excluding lamps of heading 8539) | 2.5% | 0.7% | 122.36 | 0.6% | 0.8 |
| '854370 | Electrical machines and apparatus, having individual functions, n.e.s. in chapter 85 | 2.2% | 1.2% | 77.21 | 0.2% | 4.4 |
| '852580 | Television cameras, digital cameras and video camera recorders | 2.1% | 1.3% | 69.89 | 0.2% | 9.7 |
| Total of top 10 commodities | 44.9% | 5048.63 | 1545 | |||
| Rest of the commodities under HS code 85 | 55.1% | 12425 | 2,006 | |||
| HS 39 - Plastics and articles | ||||||
| '392690 | Articles of plastics and articles of other materials of heading 3901 to 3914, n.e.s (excluding ... | 9.2% | 10.4% | 549.41 | 0.8% | 17.6 |
| '390120 | Polyethylene with a specific gravity of >= 0,94, in primary forms | 3.1% | 4.7% | 403.32 | 1.4% | 42.6 |
| '390410 | Poly"vinyl chloride", in primary forms, not mixed with any other substances | 2.6% | 1.9% | 17.55 | 0.2% | 0.001 |
| '392010 | Plates, sheets, film, foil and strip, of non-cellular polymers of ethylene, not reinforced, ... | 3.3% | 2.5% | 81.52 | 0.5% | 1.4 |
| '390690 | Acrylic polymers, in primary forms (excluding poly"methyl methacrylate") | 3.4% | 2.4% | 98.25 | 0.7% | 0.7 |
| '390230 | Propylene copolymers, in primary forms | 2.8% | 2.3% | 35.04 | 0.2% | 0 |
| '390210 | Polypropylene, in primary forms | 2.5% | 4.2% | 696.64 | 2.7% | 0.009 |
| '391810 | Floor coverings, whether or not self-adhesive, in rolls or in the form of tiles, and wall or ... | 2.9% | 1.4% | 43.34 | 0.5% | 5.3 |
| '392390 | Articles for the conveyance or packaging of goods, of plastics (excluding boxes, cases, crates ... | 2.9% | 1.4% | 142.7 | 1.7% | 12.9 |
| '392321 | Sacks and bags, incl. cones, of polymers of ethylene | 2.9% | 1.8% | 159.84 | 1.3% | 0.4 |
| Total of top 10 commodities | 35.6% | 2227.61 | 80.91 | |||
| Rest of the commodities under HS code 39 | 64.4% | 7277 | 243 | |||
| HS 71 - Gems and Jewelry | ||||||
| '710812 | Gold, incl. gold plated with platinum, unwrought, for non-monetary purposes (excluding gold in powder form) | 52.3% | 38.4% | 117.01 | 0.05% | 0 |
| '711291 | Waste and scrap of gold, incl. metal clad with gold, and other waste and scrap containing gold or gold compounds, of a kind used principally for the recovery of precious metal (excluding ash containing gold or gold compounds, waste and scrap of gold melted down into unworked blocks, ingots, or similar forms, and sweepings and ash containing precious metals) |
13.0% | 1.5% | 0.04 | 0.0% | 0 |
| '710691 | Silver, incl. silver plated with gold or platinum, unwrought (excluding silver in powder form) | 8.0% | 2.1% | 0.02 | 0.0% | 0 |
| Total of top 3 commodities | 73.4% | 117.07 | 0 | |||
| Rest of the commodities under HS code 71 | 26.6% | 33,779 | 519 | |||
| HS 30 - Pharmaceutical | ||||||
| '300490 | Medicaments consisting of mixed or unmixed products for therapeutic or prophylactic purposes, put up in measured doses "incl. those in the form of transdermal administration" or in forms or packings for retail sale (excluding medicaments containing antibiotics, medicaments containing hormones or steroids used as hormones, but not containing antibiotics, medicaments containing alkaloids or derivatives thereof but not containing hormones or antibiotics and medicaments containing provitamins, vitamins or derivatives thereof used as vitamins) |
46.9% | 48.6% | 12410.94 | 4.2% | 46 |
| '300215 | Immunological products, put up in measured doses or in forms or packings for retail sale | 18.2% | 15.6% | 127.9 | 0.1% | 0.005 |
| '300212 | Antisera and other blood fractions | 7.1% | 4.5% | 61.21 | 0.2% | 0.003 |
| Total of top 3 commodities | 72.1% | 12,600.05 | 46.01 | |||
| Rest of the commodities under HS code 90 | 27.9% | 16,340 | 114 | |||
| HS 72 & 73 - Iron and Steel Articles | ||||||
| '732690 | Articles of iron or steel, n.e.s. (excluding cast articles or articles of iron or steel wire) | 5.6% | 7.0% | 731.42 | 1.7% | 281.8 |
| '721049 | Flat-rolled products of iron or non-alloy steel, of a width of >= 600 mm, hot-rolled or <>br>cold-rolled "cold-reduced", not corrugated, plated or coated with zinc (excluding electrolytically plated or coated with zinc) |
3.8% | 3.3% | 349.64 | 1.6% | 0.1 |
| '731815 | Threaded screws and bolts, of iron or steel, whether or not with their nuts and washers (excluding coach screws and other wood screws, screw hooks and screw rings, self-tapping screws, lag screws, stoppers, plugs and the like, threaded) |
4.4% | 2.7% | 280.16 | 1.5% | 1.8 |
| '730890 | Structures and parts of structures, of iron or steel, n.e.s. (excluding bridges and bridge-sections, towers and lattice masts, doors and windows and their frames, thresholds for doors, props and similar equipment for scaffolding, shuttering, propping or pit-propping) |
4.3% | 4.9% | 482.86 | 1.3% | 11.5 |
| '730630 | Tubes, pipes and hollow profiles, welded, of circular cross-section, of iron or non-alloy steel (excluding products having internal and external circular cross-sections and an external diameter of > 406,4 mm, or line pipe of a kind used for oil or gas pipelines or casing and tubing of a kind used in drilling for oil or gas) |
2.5% | 0.9% | 249.57 | 3.6% | 22.6 |
| '721420 | Bars and rods, of iron or non-alloy steel, with indentations, ribs, groves or other deformations produced during the rolling process | 2.3% | 1.7% | 130.21 | 1.2% | 0 |
| '721633 | H sections of iron or non-alloy steel, not further worked than hot-rolled, hot-drawn or hot-extruded, of a height >= 80 mm |
2.3% | 0.6% | 3.88 | 0.1% | 0.3 |
| '732290 | Air heaters and hot-air distributors, incl. distributors which can also distribute fresh or conditioned air, non-electrically heated, incorporating a motor-driven fan or blower, and parts thereof, of iron or steel |
2.2% | 0.2% | 0.34 | 0.0% | 0 |
| '731816 | Nuts of iron or steel | 2.0% | 0.9% | 65.37 | 1.1% | 0.8 |
| '730429 | Casing and tubing, seamless, of iron or steel, of a kind used in drilling for oil or gas (excluding products of cast iron) |
1.8% | 0.9% | 13.17 | 0.3% | 0.003 |
| Total of top commodity | 31.2% | 2306.62 | 318.9 | |||
| Rest of the commodities under HS code 72 & 73 | 68.9% | 16,994 | 631 | |||
| HS 94 - Furnitures | ||||||
| '940190 | Parts of seats, n.e.s. | 16.5% | 3.7% | 65.15 | 0.2% | 7.3 |
| '940161 | Upholstered seats, with wooden frames (excluding convertible into beds) | 8.4% | 1.0% | 17.21 | 0.1% | 0.2 |
| '940320 | Metal furniture (excluding for offices, seats and medical, surgical, dental or veterinary ... | 7.6% | 7.5% | 133.61 | 0.8% | 14.2 |
| '940540 | Electric lamps and lighting fittings, n.e.s. | 7.1% | 1.9% | 33.88 | 0.1% | 2.6 |
| '940360 | Wooden furniture (excluding for offices, kitchens and bedrooms, and seats) | 7.1% | 30.5% | 540.27 | 2.1% | 33 |
| '940510 | Chandeliers and other electric ceiling or wall lighting fittings (excluding for lighting public ... | 7.0% | 3.0% | 53.54 | 0.3% | 17.9 |
| '940390 | Parts of furniture, n.e.s. (excluding of seats and medical, surgical, dental or veterinary ... | 6.4% | 1.7% | 30.14 | 0.2% | 6.3 |
| '940350 | Wooden furniture for bedrooms (excluding seats) | 4.2% | 0.7% | 12.34 | 0.1% | 0.2 |
| '940490 | Articles of bedding and similar furnishing, fitted with springs or stuffed or internally filled ... | 4.0% | 26.1% | 462.34 | 4.0% | 87.5 |
| Total of top 9 commodities | 68.3% | 1348.48 | 169.2 | |||
| Rest of the commodities under HS code 94 | 31.7% | 1772 | 242 | |||
| HS 29 - Organic chemicals | ||||||
| '293729 | Steroidal hormones, their derivatives and structural analogues, used primarily as hormones (excluding cortisone, hydrocortisone, prednisone "dehydrocortisone", prednisolone "dehydrohydrocortisone", halogenated derivatives of corticosteroidal hormones, oestrogens and progestogens) |
11.2% | 0.8% | 94.6 | 2.4% | 0.2 |
| '293590 | Sulphonamides (excl. perfluorooctane sulphonamides) | 8.4% | 2.6% | 239.66 | 2.4% | 1.4 |
| '293499 | Nucleic acids and their salts, whether or not chemically defined; heterocyclic compounds (excluding with oxygen only or with nitrogen hetero-atom[s] only, compounds containing in the structure an unfused thiazole ring or a benzothiazole or phenothiazine ring-system, not further fused and aminorex "INN", brotizolam "INN", clotiazepam "INN", cloxazolam "INN", dextromoramide "INN", haloxazolam "INN", ketazolam "INN", mesocarb "INN", oxazolam "INN", pemoline "INN", phendimetrazine "INN", phenmetrazine "INN", sufentanil "INN", and salts thereof, and inorganic or organic compounds of mercury whether or not chemically defined, and products of 3002 10) |
5.7% | 4.2% | 516.03 | 3.0% | 4 |
| '290110 | Saturated acyclic hydrocarbons | 3.1% | 0.9% | 15.94 | 0.4% | 0.07 |
| '293399 | Heterocyclic compounds with nitrogen hetero-atom[s] only (excluding those containing an unfused pyrazole, imidazole, pyridine or triazine ring, whether or not hydrogenated, a quinoline or isoquinoline ring-system, not further fused, whether or not hydrogenated, a pyrimidine ring, whether or not hydrogenated, or piperazine ring in the structure, and lactams, alprazolam "INN", camazepam "INN", chlordiazepoxide "INN", clonazepam "INN", clorazepate, delorazepam "INN", diazepam "INN", estazolam "INN", ethyl loflazepate "INN", fludiazepam "INN", flunitrazepam "INN", flurazepam "INN", halazepam "INN", lorazepam "INN", lormetazepam "INN", mazindol "INN", medazepam "INN", midazolam "INN", nimetazepam "INN", nitrazepam "INN", nordazepam "INN", oxazepam "INN", pinazepam "INN", prazepam "INN", pyrovalerone "INN", temazepam "INN", tetrazepam "INN" and triazolam "INN", and salts thereof) |
2.7% | 3.8% | 863.44 | 5.6% | 3.2 |
| '290123 | Butene "butylene" and isomers thereof | 2.4% | 0.1% | 4.55 | 0.6% | 0 |
| '294190 | Antibiotics (excluding penicillins and their derivatives with a penicillanic acid structure, salts thereof, streptomycins, tetracyclines, chloramphenicol and erythromycin, their derivatives and salts thereof) |
2.1% | 2.0% | 542.8 | 7.4% | 7.1 |
| '293359 | Heterocyclic compounds with nitrogen hetero-atom[s] only, containing a pyrimidine ring, whether or not hydrogenated, or piperazine ring in the structure (excluding malonylurea "barbituric acid" and its derivatives, allobarbital "INN", amobarbital "INN", barbital "INN", butalbital "INN", butobarbital "INN", cyclobarbital "INN", methylphenobarbital "INN", pentobarbital "INN", phenobarbital "INN", secbutabarbital "INN", secobarbital "INN", vinylbital "INN", loprazolam "INN", mecloqualone "INN", methaqualone "INN" and zipeprol "INN", and salts thereof) |
1.8% | 5.1% | 371.1 | 1.8% | 4.5 |
| '290321 | Vinyl chloride "chloroethylene" | 1.8% | 0.6% | 0.002 | 0.0% | 0 |
| '292122 | Hexamethylenediamine and its salts | 1.8% | 0.3% | 0.03 | 0.0% | 0 |
| Total of top 10 commodities | 41% | 2648.15 | 20.47 | |||
| Rest of the commodities under HS code 29 | 59% | 17830 | 475 | |||
| HS 61 & 62 - Apparels | ||||||
| '611030 | Jerseys, pullovers, cardigans, waistcoats and similar articles, of man-made fibres, knitted or crocheted (excluding wadded waistcoats) | 7.2% | 5.5% | 68.66 | 0.3% | 2.5 |
| '611020 | Jerseys, pullovers, cardigans, waistcoats and similar articles, of cotton, knitted or crocheted (excluding wadded waistcoats) | 6.6% | 5.9% | 170.27 | 0.7% | 16.9 |
| '620342 | Men's or boys' trousers, bib and brace overalls, breeches and shorts, of cotton (excluding knitted or crocheted, underpants and swimwear) |
4.6% | 5.6% | 439.43 | 1.8% | 10.9 |
| '610910 | T-shirts, singlets and other vests of cotton, knitted or crocheted | 4.9% | 6.6% | 1727.53 | 5.7% | 41.8 |
| '620462 | Women's or girls' trousers, bib and brace overalls, breeches and shorts of cotton (excluding knitted or crocheted, panties and swimwear) |
4.2% | 4.4% | 196.43 | 1.0% | 34.9 |
| '610463 | Women's or girls' trousers, bib and brace overalls, breeches and shorts of synthetic fibres, knitted or crocheted (excluding panties and swimwear) |
2.8% | 1.7% | 20.36 | 0.3% | 8.3 |
| '621010 | Garments made up of felt or nonwovens, whether or not impregnated, coated, covered or laminated (excluding babies' garments and clothing accessories) |
2.8% | 1.8% | 31.52 | 0.5% | 1.4 |
| '620193 | Men's or boys' anoraks, windcheaters, wind jackets and similar articles, of man-made fibres (not knitted or crocheted and excluding suits, ensembles, jackets, blazers, trousers and tops of ski suits) |
2.6% | 2.3% | 4.69 | 0.1% | 0.08 |
| '620293 | Women's or girls' anoraks, windcheaters, wind jackets and similar articles, of man-made fibres (not knitted or crocheted and excluding suits, ensembles, jackets, blazers, trousers and tops of ski suits) |
2.5% | 2.2% | 3.03 | 0.0% | 0.06 |
| '620520 | Men's or boys' shirts of cotton (excluding knitted or crocheted, nightshirts, singlets and other vests) | 2.5% | 2.4% | 709.24 | 7.1% | 7.9 |
| Total of top 10 commodities | 40.6% | 3,371.16 | 124.74 | |||
| Rest of the commodities under HS code 72 | 59.4% | 14,710 | 1620 | |||
